
Geodetic strain and slip deficits reveal where the Tianshan is storing stress and which faults may generate the next major earthquakes in the region.
seismology
Posted inEditors' Highlights
Are We Really Seeing More Foreshocks with Enhanced Catalogs?
Different definitions and selection methods can lead to large differences in estimated foreshock rates; however, robust statistical method shows that foreshock rates are similar between standard and enhanced catalog.
Posted inEditors' Highlights
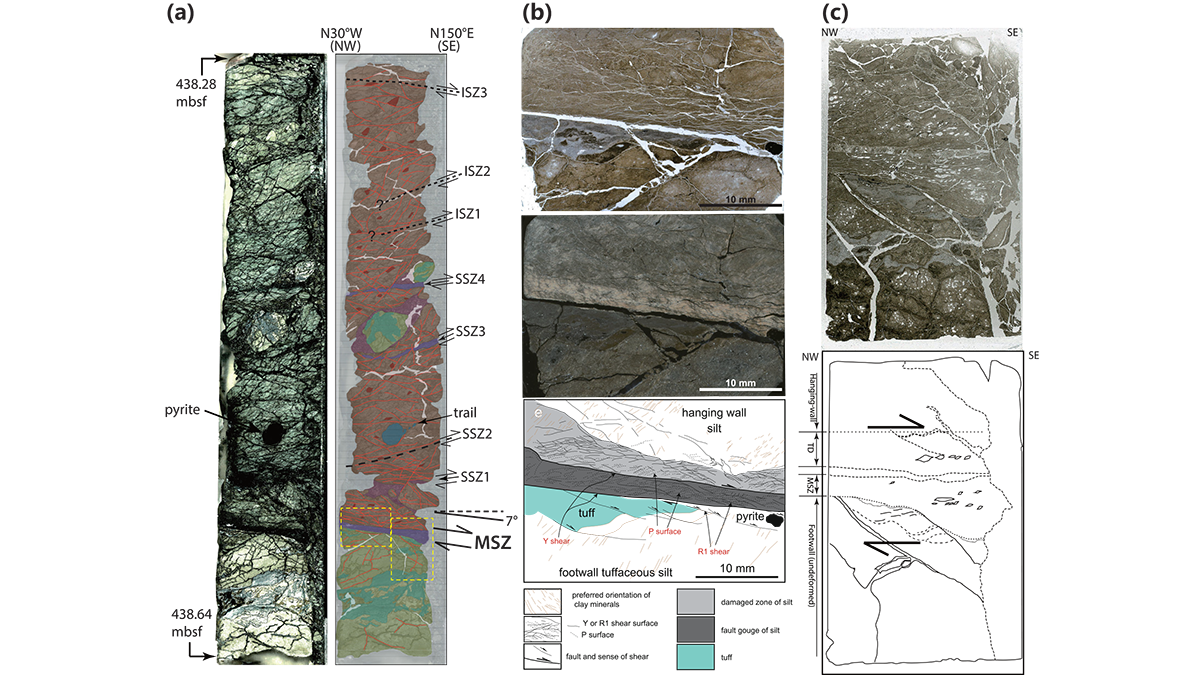
Frictional Properties of the Nankai Accretionary Prism
A database of frictional properties from IODP drilling materials explores the range of slip spectrum and the generation of slow to fast earthquakes in the Nankai subduction zone in light of mineralogy.

Posted inNews
The Land Beneath Antarctica’s Ice Might Be Full of Water
Seismic surveys hint at the extent of a potential groundwater system in the White Continent.
Posted inEditors' Highlights
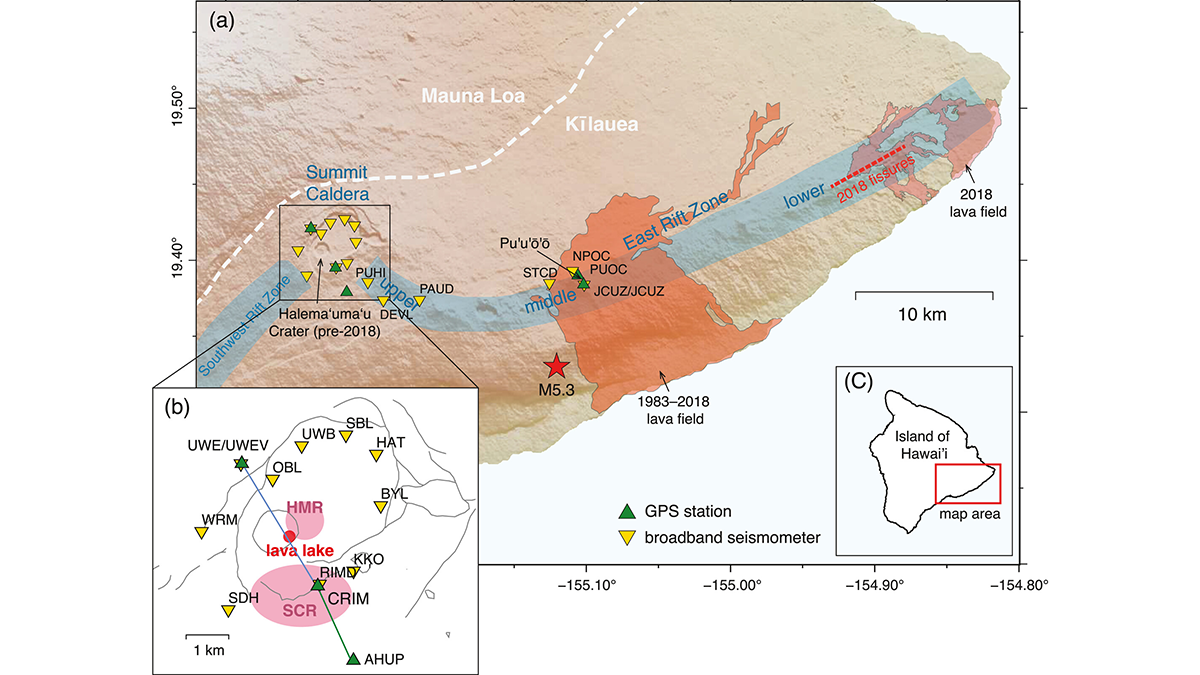
Complex Plumbing Dynamics for Kīlauea Volcano
A new analysis of subtle seismic velocity changes provides insights into the coupling of magma reservoirs of Hawaiian volcanoes.
Posted inNews
The Ridgecrest Earthquake Left Enduring Damage in Earth’s Deep Crust
The shallow crust has recovered since California’s 2019 quake, but damage persists at depths greater than 10 kilometers.

Posted inNews
AI is Changing our Understanding of Earthquakes
Machine learning is expanding scientists’ catalogs of quakes and refining maps of underground faults. It also promises to improve quake forecasts.

Posted inResearch Spotlights
New Earthquake Model Goes Against the Grain
Subducting plates are stronger in certain directions than others, which may be a factor in how earthquakes occur and how seismic waves propagate.

Posted inEditors' Vox
When the Earth Moves: 25 Years of Probabilistic Fault Displacement Hazards
Surface ruptures causing earthquakes pose risks to infrastructure and human lives, but advances in models and data in the last few decades have improved our ability to mitigate their effects.

Posted inNews
Scientists Tune In to the Ocean’s Sound Waves
A new technique detects inaudible acoustic signals from crashing waves, opening up possibilities for monitoring sea and atmospheric conditions from shore.