
Taking the train or subway can be a time and cost-efficient way for city dwellers to commute. But during the summer months, some metro riders risk exposure to extreme heat, the deadliest weather-related hazard in the United States, while walking to and from stations.
A team of researchers at George Mason University in Fairfax, Va., analyzed the surface temperatures of walkways within a 10-minute walk of the three U.S. metro systems with the largest ridership. Then, they considered how socioeconomic factors, such as age and race, and development patterns, such as parking lots and indoor walkways, were related to differing levels of heat exposure.
The project began out of curiosity, said Luis Ortiz, an urban climate scientist at George Mason University. “It combines two of my big passions,” he said. As a longtime urban heat researcher and avid public transit user, Ortiz sought to answer a question from his day-to-day life: “If you’re a pedestrian using public transportation, what does your heat exposure look like?”
Black, Asian, and Hispanic commuters experience higher exposure to extreme heat.
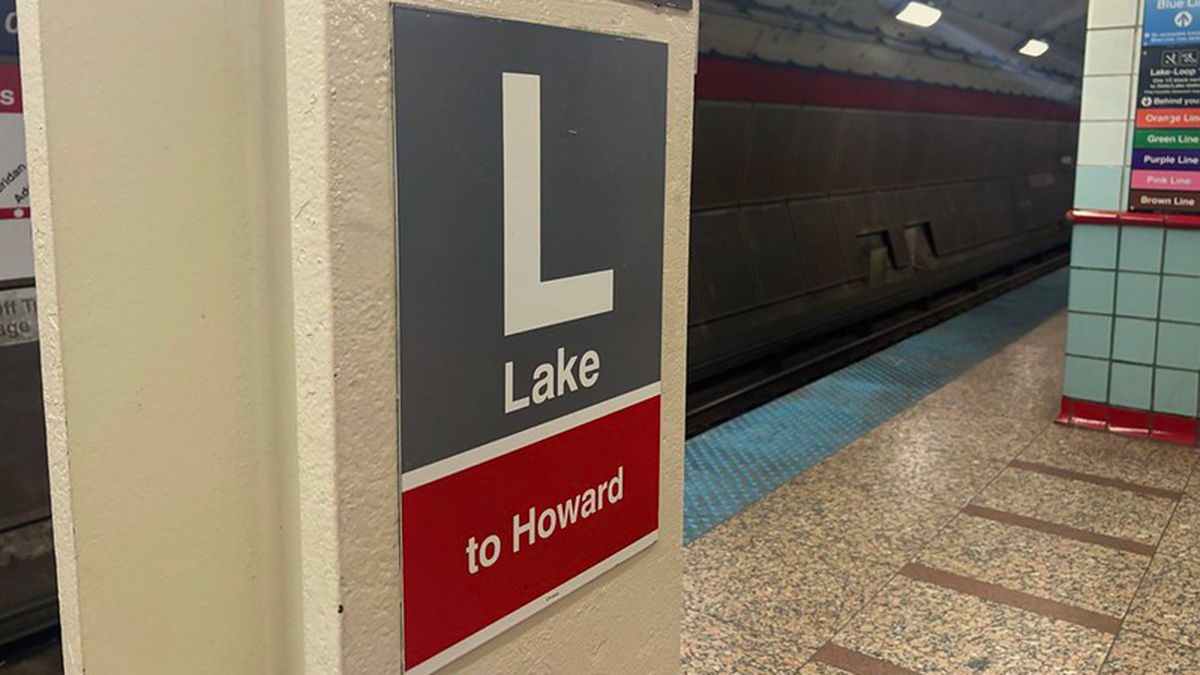
The scientists combined station ridership data and Landsat 8 estimates of surface temperature to map where pedestrian public transit users were most exposed to heat on the New York City Subway, the Washington Metro, and the Chicago “L.” Ortiz will present the results on 16 December at AGU’s Annual Meeting 2025 in New Orleans.
The researchers found that the correlation between socioeconomic and demographic variables and surface temperatures were highest for the Chicago L and lowest for the Washington Metro. One pattern the researchers observed across all three cities is that commuters with minoritized identities, including Black, Asian, and Hispanic commuters, experience higher exposure to extreme heat, said coauthor Alireza Ermagun, a transportation scientist. So, too, do elderly populations and metro users between age 25 and 44.
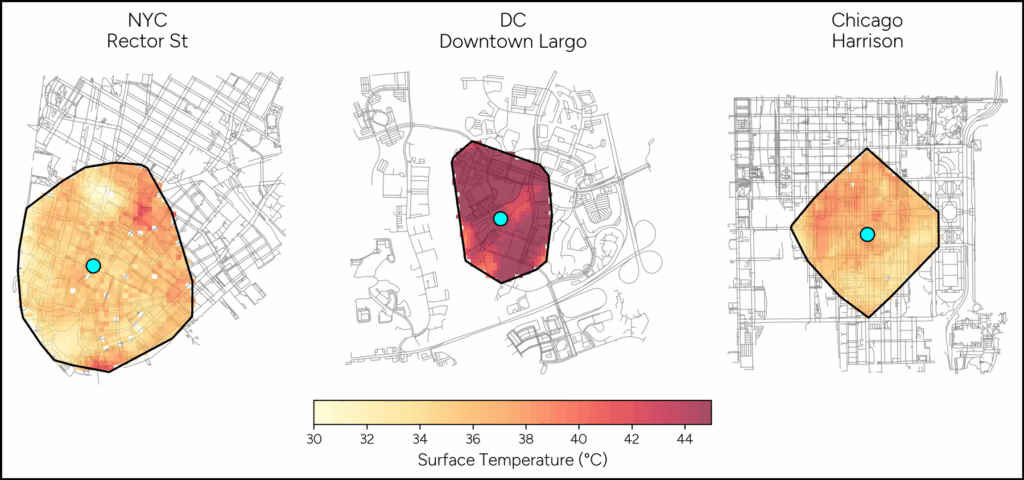
One result from the Washington Metro system seemed to contradict these correlations: Some of the hottest stations are in relatively wealthy areas of northern Virginia. Researchers attribute the unexpected finding to people driving to metro stations and parking a car. “They have massive parking lots there that get very hot in the afternoon,” Ortiz said.
A Green Solution
Urban planners should use research like this to strategize where to put shade and green space, said Nadav Sprague, an environmental epidemiologist at Harvard University who was not involved in the study. “Having access to shade is very important,” he said.
Many of the walking routes with high heat exposure have very few trees, Ortiz said. He said that trees “solve several of the issues” that cause heat stress by providing shade, reducing heat radiation into the body, and cooling the air.
“The best shade shelters are the trees.”
Transit users agree. “The best shade shelters are the trees,” said Jasper Elysian, a student at the University of Illinois Chicago who takes public transit to school, work, and almost everywhere. When it’s available, Elysian uses shade to combat the heat but said they would like to see more trees near transit stops.
Quantifying heat exposure to understand who is exposed and how is important, Sprague said, because it’s a hyperlocal problem requiring localized solutions. This research “gets at the point that each…place [faces] different implications of climate change.”
To better understand each city’s specific challenges, Ortiz and Ermagun said they want to collect more data on how often people in these cities in different socioeconomic situations use public transit and whether this usage is affected by the heat exposure they endure.
Recognizing that cities and counties have limited budgets, Ermagun hopes the team’s analysis will help decisionmakers identify where funds can be most useful in mitigating climate vulnerability. The ideal audience for this work, he said, is transportation designers.
—Pepper St. Clair (@pepperstclair.bsky.social), Science Writer