
Measurements collected on a scientific drift station half a century ago were published for the first time this summer, dramatically increasing the number of heat flow readings of the Arctic seafloor.
The data hail from places so remote in the Arctic Ocean that researchers would typically need a submarine or icebreaker to reach them. Scientists took the measurements while living on a massive iceberg that had broken off from an ice sheet, called an ice island, between 1963 and 1973.
“A lot of these places have never been visited again by anyone.”
The study, released 10 July in the Journal of Geophysical Research: Solid Earth, is the first in-depth look at marine heat flow measurements of the western Arctic Ocean. The data provide clues to the geologic history of the region, one of the final sections of seafloor whose origin and age remain unclear.
“These men spent months and months on this island under extreme conditions just to get the science,” said lead author Carolyn Ruppel, a geophysicist at the U.S. Geological Survey (USGS) based in Woods Hole, Mass. “A lot of these places have never been visited again by anyone.”
Adrift
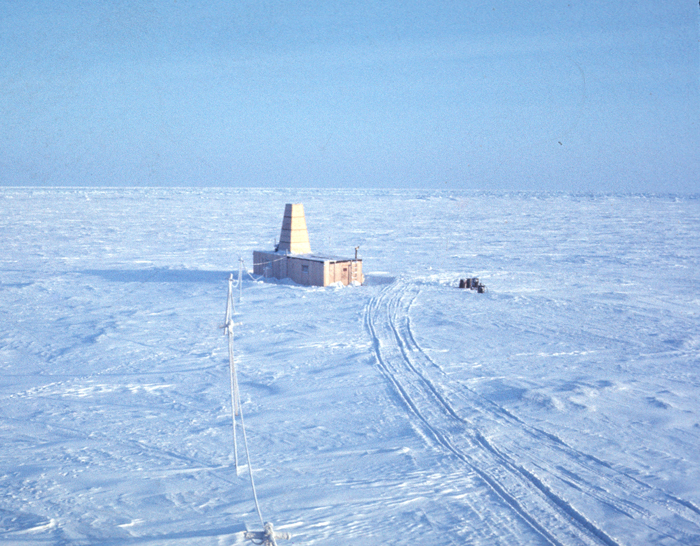
Researchers set up camp on Fletcher’s Ice Island, also known as T3, during the Cold War as part of a strategic and scientific campaign. The ice island stretched more than 77 square kilometers, an area larger than Manhattan, and its level surface made it ideal for landing aircraft. The U.S. Air Force established a weather station on the island in the 1950s, after first spotting the island on reconnaissance flights in 1946.

A collection of other government agencies, university research groups, and indigenous residents employed by the Naval Arctic Research Laboratory began scientific studies on the ice island in the following decades, conducting meteorological, oceanographic, and geophysical surveys from the island. Before satellites, the researchers living on the island tracked their location with techniques similar to those of early 20th century Arctic explorers, using a theodolite to note the position of the Sun and the stars.
The latest study publishes temperature measurements of the Arctic seafloor, known as marine heat flow data, taken by USGS starting in 1963. The data describe how much thermal energy is transferred through ocean sediments, measured by metal probes several meters long that pierced the seabed. Marine heat flow data were instrumental in discovering seafloor spreading in the 1960s, a crucial component of the theory of plate tectonics, and scientists use it as one way to weave together the geologic story of an ocean basin.
The Mysterious Western Arctic Ocean
Geologists collected the bulk of the world’s marine heat flow data during a flurry of ocean exploration in the mid-20th century. Researchers raced around the globe, probing the seafloor for temperature readings from shallow plateaus to deep-sea trenches. As they filled in maps with data, one area remained largely untouched: the western Arctic Ocean.
“It’s the largest area of seafloor in the world that we don’t know how, or exactly when, it formed,” Matt O’Regan, a research scientist in the Department of Geological Sciences at Stockholm University in Sweden, told Eos. The Arctic’s western half is framed by two Canadian territories, Northwest Territories and Yukon, and the U.S. state of Alaska. “There have been decades of debate about how it actually came into existence,” O’Regan said.
Part of the mystery, said O’Regan, was due to a lack of heat flow measurements available in the region. Before the study’s publication, heat flow measurements of the deep western Arctic Ocean totaled only 25 data points. USGS scientists collected 356 marine heat flow measurements while camped on the ice floe, increasing the number of measurements in the area by more than 15.
O’Regan called the newly released data “a fantastic contribution.”
“It’s really one of these great legacy data sets,” he said.
Restoring a Lost Data Set
Until now, “it was effectively a lost data set.”
At the end of the experiment on Fletcher’s Ice Island, Ruppel said that USGS quickly shifted focus, directing its scientists to study the North Slope of Alaska, where petroleum interests had grown. The researchers published a few summaries of the marine heat flow measurements, but until now, she said, “it was effectively a lost data set.”
Working on a data set taken more than half a century ago was challenging, said Ruppel, because she didn’t have intimate knowledge of the equipment and experimental methods. The measurements from the study were collected before Ruppel left elementary school, and many of the people involved have since passed away.
Ruppel worked with one of the surviving researchers, retired USGS scientist and study coauthor Art Lachenbruch, who orchestrated experiments on Fletcher’s Ice Island and published preliminary interpretations of a small portion of the data in the 1960s.
Piecing together information from online chat boards, interviews, and old reports, Ruppel re-created metadata for the study.
The latest paper contains the first thorough analysis of the heat flow data, pairing it with seismic data taken since the 2000s. The authors used a simple numerical model to test predictions against the observed data. Among other findings, the study suggests that shallowly circulating fluid in the ocean crust may be one factor contributing to heat flow measurements varying substantially throughout the study area.
Andy Fisher, a professor at the University of California, Santa Cruz who was not involved with the research, called the data “scattered” because researchers had no control over where the ice island went. But, Fisher went on to say, the trove of measurements is “really important for helping to motivate more careful, more fine-scale work.”
Fisher, who has studied marine heat flow measurements for much of his career, called seeing the data “thrilling.”
Renewed interest in marine heat flow data has blossomed in the past 10 years, according to O’Regan. Scientists studying the biogeochemistry of the seafloor, the fate of frozen stores of methane called marine hydrates, and the slow degradation of permafrost are turning to marine heat flow as an important foundation for their experiments.
Although the latest study brings to light data from deeper waters far from the continental shelf where many of the contemporary studies take place, said O’Regan, “you really need this sort of continuum out into the deep basin to see how things evolve and why they’re changing.”
For Fisher, the legacy of the data lies not only in what they could help scientists uncover but also as an homage to those that took the data in the first place. “This was a serious campaign,” he said. “This data was hard won.”
“People were camped out for years,” Fisher added. “They could have been lost to history. These authors brought them to life.”
—Jenessa Duncombe (@jrdscience), News Writing and Production Fellow
Citation:
Duncombe, J. (2019), Scientists rescue historical data taken on floating ice island, Eos, 100, https://doi.org/10.1029/2019EO131523. Published on 27 August 2019.
Text © 2019. AGU. CC BY-NC-ND 3.0
Except where otherwise noted, images are subject to copyright. Any reuse without express permission from the copyright owner is prohibited.
Text © 2019. AGU. CC BY-NC-ND 3.0
Except where otherwise noted, images are subject to copyright. Any reuse without express permission from the copyright owner is prohibited.