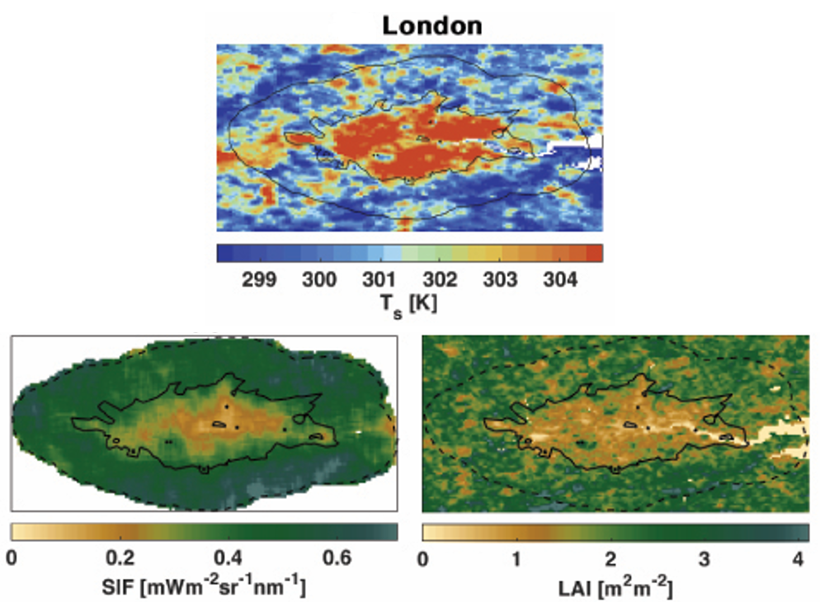
Satellite data reveals that urban vegetation, especially urban forests, is the most important factor regulating Urban Heat Island intensity.
Editors’ Highlights

Posted inEditors' Highlights
Dune Aurora Explained by Satellite-Ground Studies
Spacecraft observations support the mechanism for explaining auroral dunes observed from the ground by citizen scientists.
Posted inEditors' Highlights
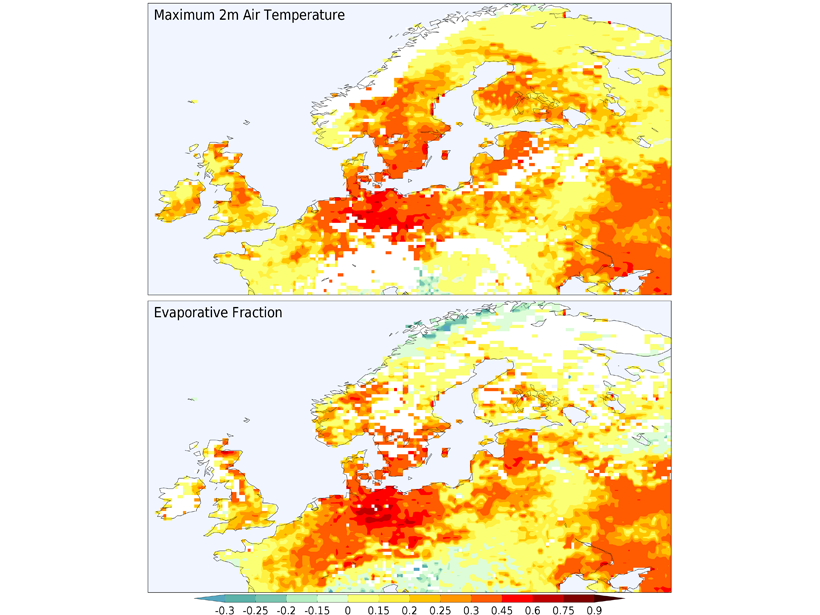
Dry Soils Enhanced the 2018 Heatwave in Northern Europe
A range of observations show that a shift in land-atmosphere coupling exacerbated the hot drought experienced in Europe in 2018.
Posted inEditors' Highlights
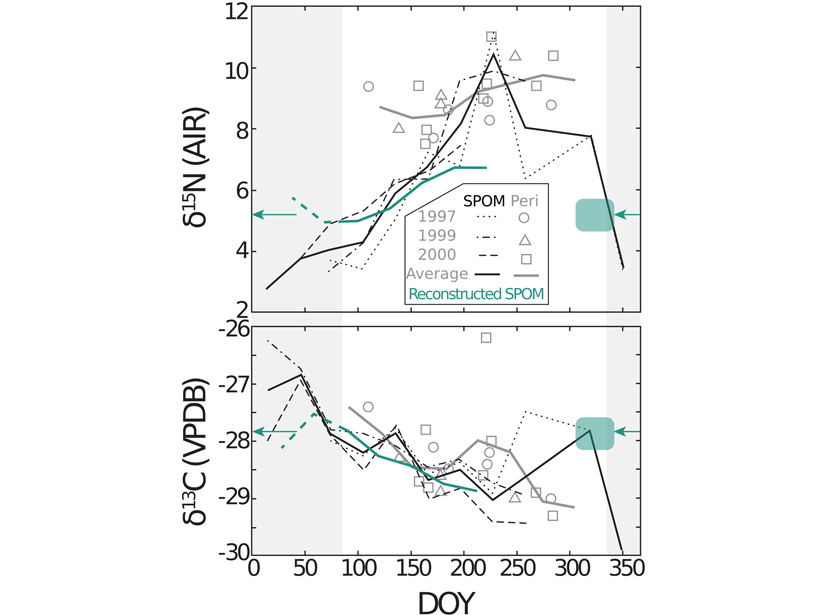
Tracking Excess Nitrogen with Freshwater Mussels
Mussel shell periostracum and carbonate bound organic matter document seasonal variability in the isotopic composition of riverine suspended particulate organic matter.
Posted inEditors' Highlights
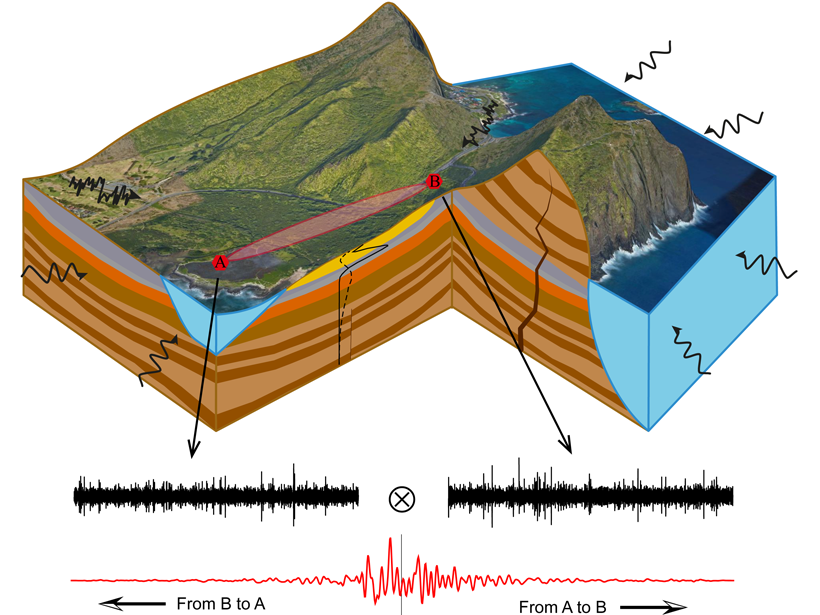
Revealing Complexity of Groundwater Flow with Hydrogeophysics
A combination of passive seismic and electrical measurements are used to unravel the complex hydrogeology structure and associated groundwater flow paths at a coastal site in O’ahu, Hawai`i.

Posted inEditors' Highlights
How Not to Homogenize a Planet
Even the strong heating from short-lived aluminium-26 (26Al) would not be able to homogenize the interior of a Mars‐sized planetary embryo.
Posted inEditors' Highlights
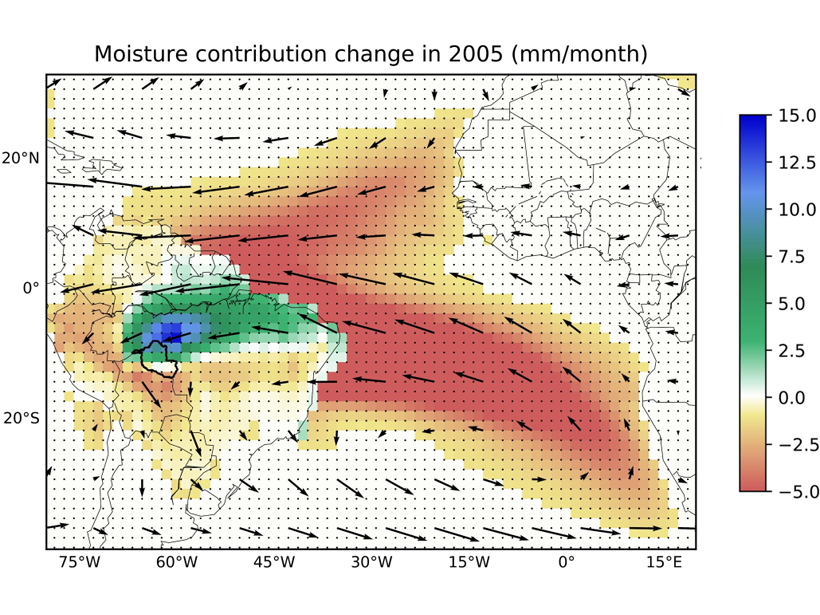
Upwind Forest Buffers Rondonia Cropland Against Regional Drought
During severe Amazonia droughts when oceanic supply of moisture failed, the magnitude of rainfall reduction over Rondonia was moderated by enhanced moisture supply from upwind forests.
Posted inEditors' Highlights
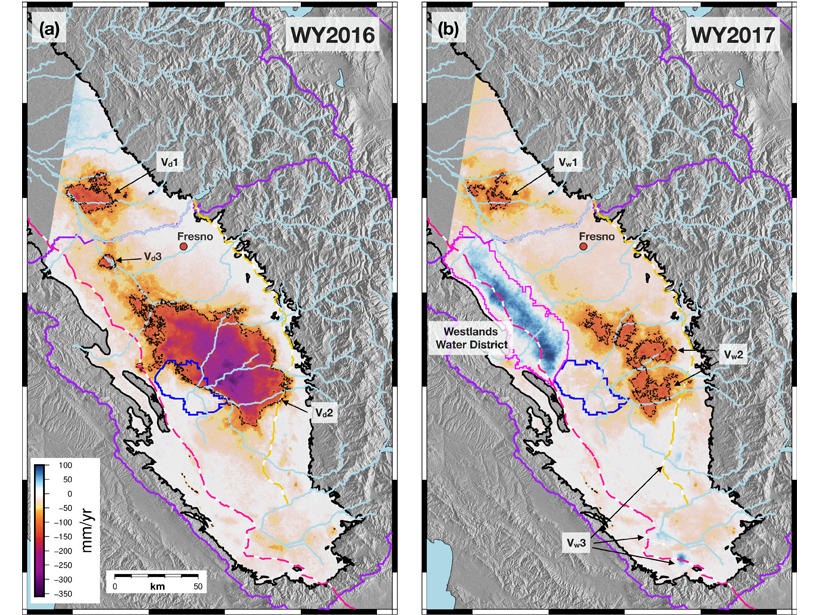
Satellites Detect Groundwater Recharge for San Joaquin Valley
A new study integrates spaceborne InSAR time series and GPS to resolve spatiotemporal patterns of deformation across the San Joaquin Valley indicating recharge areas and pathways for groundwater flow.

Posted inEditors' Highlights
Thickness and Strength of Slow-moving Landslides Revealed
Hundreds of slow-moving landslides’ deformation patterns were inverted to obtain their thickness and frictional strength, revealing that larger landslides are weaker and thinner than smaller ones.
Posted inEditors' Highlights
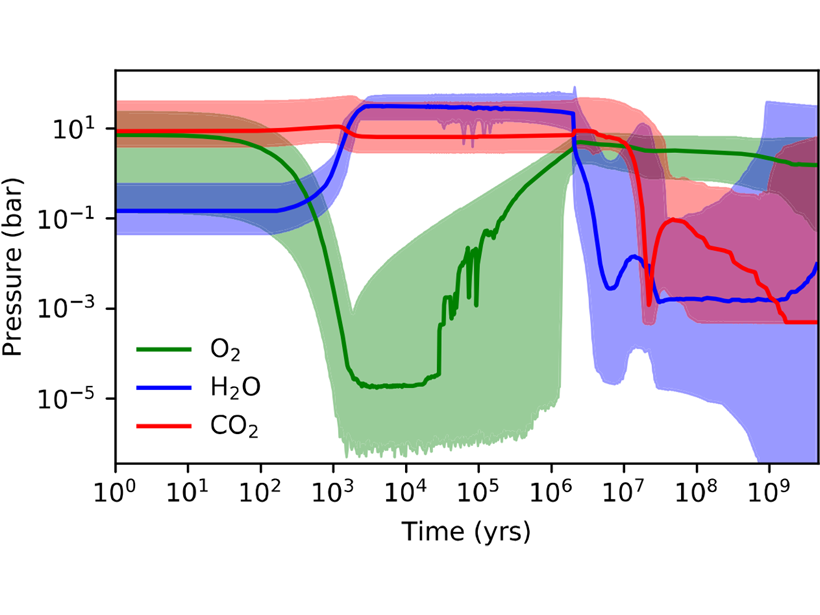
Is Atmospheric Oxygen a Planetary Signature for Life?
While some Earth-like worlds can generate significant O2 only by biology, “waterworlds” and “desert worlds” can build up O2 even without life because of chemical changes from atmosphere loss to space.