
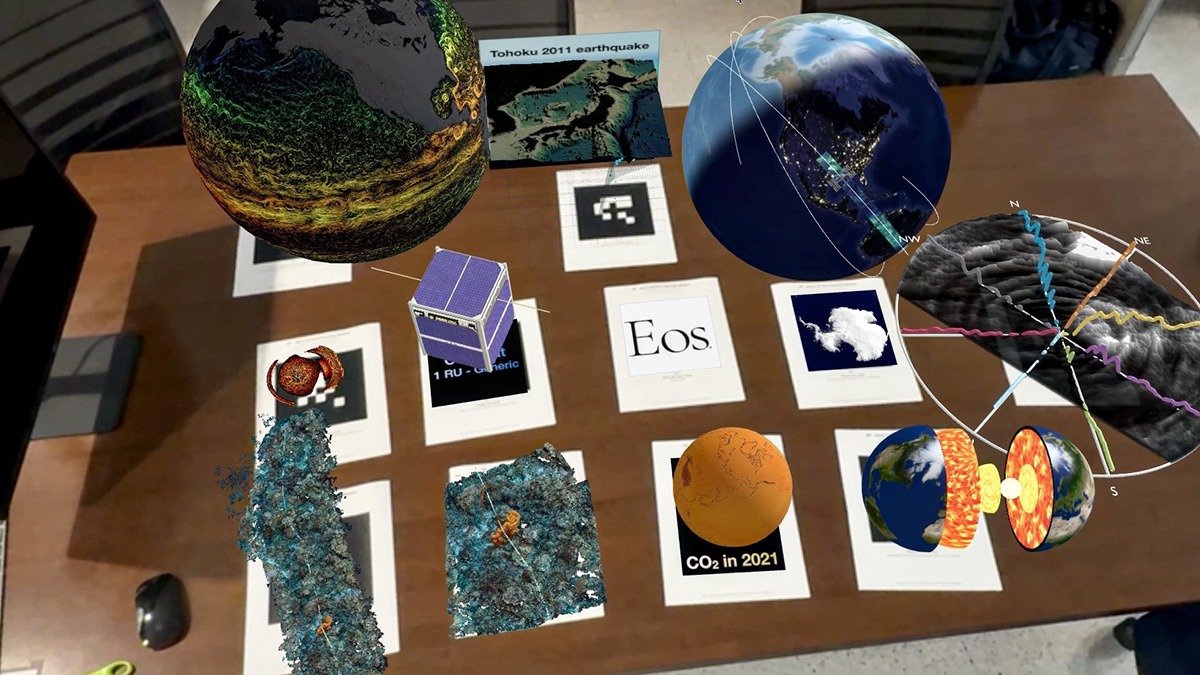
From geomorphology and marine ecosystems to satellite orbits and planetary motion, the subjects that Earth and space scientists study often span three—or more—dimensions. However, much of the visual analysis and communication of results from this work has traditionally been confined to 2D.
Across disciplines, scientists, engineers, and educators are leveraging this potential for fieldwork planning, data analysis, education, and outreach.
With the evolution and widespread adoption of extended reality (XR) and spatial computing technologies, scientists can now work natively in 3D. Innovative tools offer the ability to access otherwise unreachable environments, gain new perspectives, perform data analysis more naturally and intuitively than ever before, and showcase and explain findings in profoundly new ways.
Across disciplines, scientists, engineers, and educators are leveraging this potential for fieldwork planning, data analysis, education, and outreach. The scientific community has an opportunity to embrace and advance this trend. However, effectively integrating spatial computing technologies into scientific practice and communication first requires determining where XR excels, where it falls short, and how scientists can best support and engage with these technologies.
A variety of XR technologies exist, and we briefly review them here. These technologies offer benefits for and could be integrated into numerous uses across Earth and space science (ESS) research, education, and communication. Doing so will require overcoming challenges, including growing researchers’ fluency with XR and creating opportunities for them to apply it.
We encourage you to examine several interactive examples of 3D models related to ESS in the following embedded viewer.
You can also scan the QR code below using the XR-capable computer you likely carry in your pocket to view the same examples via augmented reality (AR).
A Spectrum of Immersion

Visual and spatial analyses of data and information have long been essential in Earth and planetary sciences. Since the early days of mapmaking and modeling, researchers have continually embraced innovative resources to represent and understand spatial relationships and patterns.
Tools such as geographic information systems (GIS) and Google Earth, which today are standard for analyzing and disseminating georeferenced data, have greatly improved our ability to assess spatial data qualitatively and quantitatively. However, they remain limited to 2D representations, even when viewed on a globe, because 3D data are still mainly accessed through 2D media such as screens or printed materials.
A growing body of work is transforming this landscape by integrating research products with advanced 3D technologies such as virtual reality (VR), data sonification, and immersive group experiences like planetariums and cave automatic virtual environments (CAVEs) (Table 1). (We use XR as an umbrella term for immersive and augmented reality 3D visualization technologies and their applications.)
Table 1. Extended Reality Technologies and Terminologies, with Associated Hardware Platforms and Notable Examples
| Term | Definition | Platforms and Hardware: Noteworthy Examples |
| Virtual reality (VR) | A fully immersive, often interactive, experience replacing the real-world environment | VR head-mounted displays (HMDs), haptic controllers: The Lab on Steam Google Earth VR,a OpenBrush (formerly TiltBrush), VR video games |
| Extended reality (XR) | An umbrella term for all immersive visualization technologies | All HMDs, smartphones, WebXR: Meta Quest, HTC Vive, XR Elite, Apple Vision Pro |
| Augmented reality (AR) | An experience that overlays virtual objects onto the real world, usually via a smartphone or tablet | AR HMDs, smartphones, tablets: Pokemon Go, Microsoft HoloLens,a Google Glass,a Ray-Ban Meta glasses, Google ARCore |
| Mixed reality (MR) | Like AR, but virtual objects are independent of real-world objects; Microsoft’s preferred term, associated with the HoloLens | HMDs: Microsoft HoloLens,a Magic Leap, Windows Mixed Reality |
| Spatial computing | Term broadly referring to technologies that facilitate the creation, visualization, and interaction with objects in 3D space, whether on screens, through HMDs, or via augmented reality interfaces | HMDs, computers, mobile phones: Apple Vision Pro, ARKit, ARCore |
| Cave automatic virtual environment (CAVE) | A room-sized, often highly customized VR space using projection screens, computer graphics, and motion tracking, although technologies vary | Customized projection rooms, such as planetariums: StarCAVE, Iowa State’s C6, CAVE2 at the University of Illinois Chicago’s Electronic Visualization Lab, Industrial Light and Magic’s StageCraft, KeckCAVES, and many others; often supported by custom software with projection mapping capability, such as OpenSpace |
| Multiuser virtual environment (MUVE) | A shared virtual space where immersed VR users interact; an immersive cyberspace | VRChat, Planetary Parfait |
| Sonification | The transformation of data into sound for analysis and outreach, often used in concert with other XR technologies | International Community for Auditory Display, NASA’s Data Sonification Project, Sonification Handbook, sonification.design |
| Haptics | The use of touch-based feedback, such as vibrations or force responses, to enhance immersion and interaction in virtual environments | Rumble motors in VR hand controllers, force feedback, ultrasonic displays |
| 360 Video | Video recordings in which a view in every direction is recorded at the same time, shot using an omnidirectional camera or a collection of cameras; can be played back on a spherical or panoramic display or on a flat display where the user controls the viewing direction of the camera | Many examples are available on YouTube |
| Stereoscopy/stereo imaging | A range of methods that produce the illusion of 3D depth on a 2D surface using the observer’s binocular vision, sometimes with the aid of 3D glasses; can be used to create limited 3D illustrations in printed media at low cost and can be employed in other media as well, including 3D movies | 3D glasses (including red/blue anaglyph, ChromaDepth, Pulfrich effect, and others), stereophotographs, autostereograms (Magic Eye) |
aLegacy platform or hardware; long-term support is no longer available.
XR uses a variety of digital objects and environments that merge the digital world with the physical world to varying degrees of immersion and interactivity. These environments range from AR, in which digital assets are superimposed on real-world objects, to fully immersive worlds in VR. Between those ends, mixed reality (MR) environments feature digital assets that behave dynamically and interact with the real-world environment surrounding the user.
The user experience of a given XR tool or application is largely determined by where it falls on the spectrum of immersion. Understanding the full scope of XR technologies is crucial to developing and deploying them effectively across platforms and audiences.
How XR Is Used in Earth and Space Sciences
Increasingly, extended reality (XR) is also being used as a storytelling tool, helping to express highly technical scientific findings as engaging narratives.
The use of XR in ESS has advanced significantly from early applications in planetariums and AR-assisted field research to fully interactive 3D models of complex geophysical data describing, for example, groundwater flow, coral reefs, and high-resolution lidar scans. Increasingly, XR is also being used as a storytelling tool, helping to express highly technical scientific findings as engaging narratives that resonate with multiple audiences and influence policymaking.
Bailenson [2019] offers a practical framework for determining how XR can best be used, suggesting it is appropriate for simulating experiences that are dangerous, impossible, counterproductive, or expensive in real life. In a virtual environment, users can engage in activities such as climbing inaccessible areas (dangerous), teleporting through solid rock (impossible), marking features in a landscape (which would be counterproductive in real life if done, for example, with spray paint), or hovering above landscapes like a drone (expensive).
Virtual field trips, classroom exercises, and museum-style VR exhibits are all examples of XR being used in an explanatory capacity in which it not only conveys information but also reduces both risks and costs. For example, a digital, browser-based VR field trip to the Whaleback anticline eliminates the risks and costs of traveling to and hiking around this site in east central Pennsylvania while providing a comprehensive and interactive study of structural geology. VR field trips can also improve the accessibility of nature and science for students with disabilities and those who may otherwise be unable to participate [Bursztyn et al., 2022].
However, researchers have cautioned that such virtual experiences should be designed carefully and intentionally to complement traditional field trips rather than replace them, because virtual experiences cannot replicate all aspects of and insights gained from in-person exploration [Carabajal and Atchison, 2020]. Nonetheless, the educational innovations and potential for scientific storytelling that XR offers can enhance students’ understanding and appreciation of real-world settings.
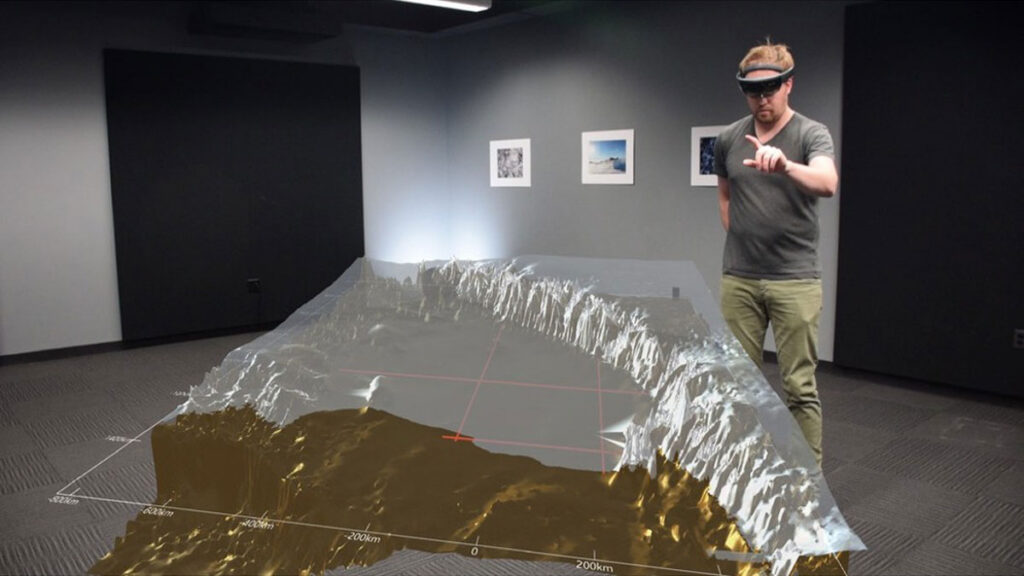
Beyond field trips and education, researchers have developed a variety of XR experiences for scientific data visualization, analysis, and interpretation. Examples include applications for refining interpretations of mantle plume tomographic models [Lu and Rudolph, 2024], analyzing digital models of geologic outcrops to estimate fault characteristics [Seers et al., 2022], displaying and sonifying earthquake data and citizen-based observations, analyzing ice sheet radar and lidar data to understand ice sheet structure and history [Tack et al., 2023; Boghosian et al., 2019], assessing flood risks in New York City [Zhang et al., 2026], and improving weather model analysis [Grubb et al., 2023].
These studies demonstrate XR’s potential for advancing research in specific domains. However, much of the existing literature related to ESS lacks robust user studies to assess the actual impact of XR innovations on scientific discovery and analysis [Gallagher et al., 2022]. The prevalence of these user-focused analyses in computer science offers a good model for other fields to follow. It also suggests a need for interdisciplinary collaboration to help researchers create, test, and use XR tools to further develop the potential of these technologies (see “Building XR Experiences” box).
Benefits for Collaboration, Convergence, and Classrooms
The studies and use cases of XR we’ve encountered in our work and that are discussed in this article support—and, in fact, require—interdisciplinary work. They all combine the tools and perspectives of computer graphics, game design, and human-machine interfaces with domain-specific data and concepts from the field being studied.
XR experiences are scalable and offer potential for widespread collaboration, codesign, and decentralized science.
In addition, XR experiences are scalable and offer potential for widespread collaboration, codesign, and decentralized science. Open VR worlds can allow collaboration in the same way multiplayer online games do—Minecraft is an example—by creating persistent virtual spaces or multiuser virtual environments that change with time and in response to external inputs. Such collaborations can be enabled through “metaverse” platforms such as VRChat.
VR also enables users to perform certain 3D tasks, such as point cloud classification, with greater fidelity, and it can enable people around the world to collaborate virtually in real time—capabilities that can support fieldwork or mission coordination, planning, and execution. Field researchers, when viewing a new location in VR, naturally develop a spatial understanding of the terrain. A geographically distributed field team can therefore use VR to coordinate and rehearse plans before meeting in the field.
Many of these benefits extend to science education, where XR tools used in research can be adapted for authentic STEM learning. In the classroom, taking on the role of a scientist in a virtual world can profoundly affect students’ STEM (science, technology, engineering, and mathematics) identities. Dede [2009, p. 67] noted that digital immersion can help lower-performing students “to build confidence in their academic abilities” and to change “their frame of self reference to successful scientist in the virtual context.” Thus, well-designed immersive experiences and instruction “may have the potential to release trapped intelligence and engagement in many learners” [Dede, 2009, p. 67].
XR tools are highly customizable and can be used to cocreate educational experiences that are personally or culturally resonant with the learner. Such authentic learning experiences particularly benefit students who do not otherwise have strong STEM inclinations or identity, in part because they can inspire deep creative engagement with digital tools—a phenomenon that Turkle [2005] called “computer holding power.”
Overcoming Barriers to Advancing XR
We argue that XR technology and applications should be further centered in ESS to benefit research and education. However, working at this interface will raise challenges for new practitioners—as it has for us—including quickly evolving hardware driven by the tech market and the increasingly ubiquitous problem of developing and maintaining high-quality, open-source scientific software.
These two issues are main contributors to what we call the “problem of orphaned demos” in the research community—that is, promising research tools that languish in the demo phase and never reach wide adoption. For example, VR field trips made by and for researchers and educators often end up as “unicorns” (i.e., one of a kind, stand-alone products) frozen in time, whereas industry-developed VR continuously improves as its platforms and approaches rapidly evolve. On top of a steep learning curve to upskill in computer graphics and 3D user interfaces, such challenges may further dissuade researchers from pursuing XR.
Scientific visualization engines such as OpenSpace help address this problem by encouraging standardization, reuse, and sharing of assets in a unified software environment. Communities of practice that bring together researchers, open-source developers, educators, and artists can also be effective for sharing best practices and maintaining longer-term support of scientific XR projects.
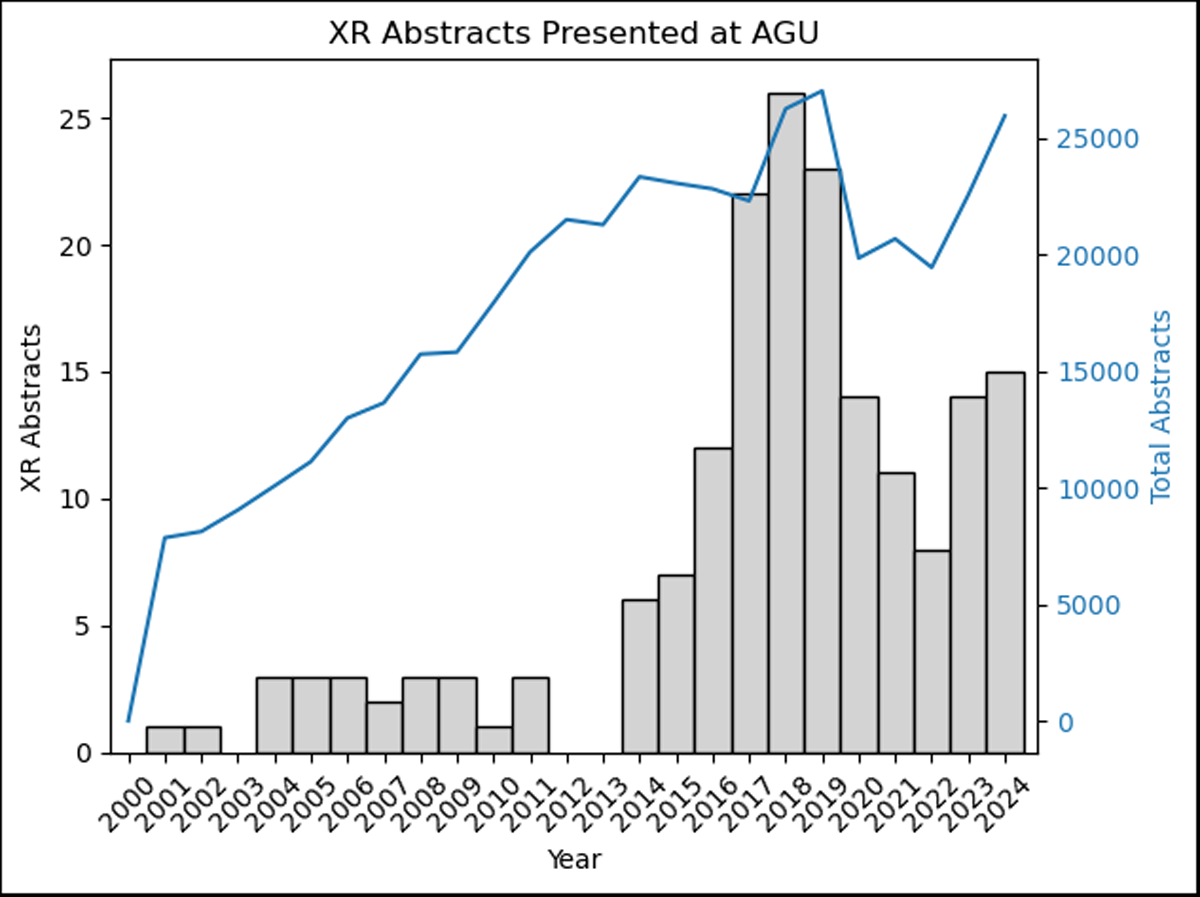
Scientific conferences are another key opportunity for learning and information sharing about XR. Interest in XR technologies at AGU’s Annual Meeting (formerly Fall Meeting), for example, has risen over the past 2 decades, as evidenced by an increase in abstracts with relevant keywords (Figure 1). We have also anecdotally observed a small, but growing, trend of presenters bringing head-worn displays to poster sessions, demonstrating a new mode of engagement with scientific data and results.
However, growing interest in XR at ESS meetings doesn’t appear to be fully reflected in the scientific literature yet. A recent literature review of immersive geovisualizations since 2010 found only 25 peer-reviewed journal articles and 6 conference papers when querying multiple databases across geoscience and computer science journals [Gallagher et al., 2022]. And an informal literature meta-analysis we conducted suggests that far more XR-related abstracts have been presented at AGU’s Annual Meeting (Figure 1) in recent decades than XR-related publications have appeared in AGU journals over the same time frame. This trend may be because of a lack of appropriate outlets for reporting scholarly XR use within ESS and because this work is instead reported through other technical societies or through informal channels.
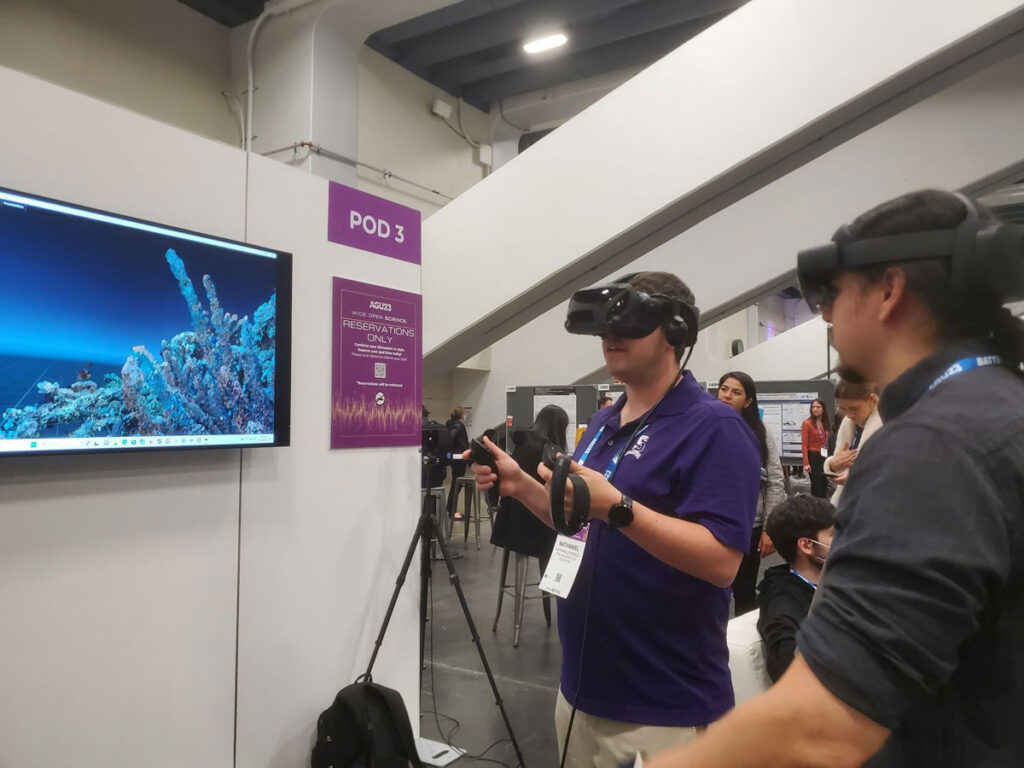
We recommend that practical steps be taken to support Earth and space scientists in thoughtfully and productively engaging with XR for research and education. At meetings, organizers can provide physical spaces that are safe for the use of headsets and other XR technology and that have adequate power supplies. Also, new session formats could be designed to facilitate presentations highlighting XR skills, demos, and development workflows.
In addition, professional societies, journal publishers, and scientific funders could develop new avenues to support experimentation with new and emerging media and to help the ESS community build fluency in XR. They could, for example, create opportunities for researchers to publish XR research and data products in new or existing journals. They could provide venues for and support research community-led efforts to share knowledge and training on XR. And they could provide targeted funding opportunities for XR-related research and education projects. Public-private partnerships in particular would be well-positioned to mitigate the orphaned demos challenge that arises in XR-related ESS research.
Each of these approaches would bring needed exposure to the uses and benefits of XR as well as drive innovation. We summarize XR’s potential with the words of futurist Jaron Lanier: You “just realize what you would otherwise have to describe” [Lanier, 2017, p. 294]. Ultimately, XR can bring enhanced spatial awareness to scientific analysis and education and help to close accessibility gaps in science communication through the use of 3D visual, spatial, and haptic representations.
Developing XR tools for widespread adoption by the research community will take time, but the application of 3D technology in scientific fields that are heavily visual and spatial by nature—as the Earth and space sciences are—is a worthy goal.
Building XR Experiences
Do you have data you’d like to visualize or interact with in XR? It’s important first to consider how you can best visualize the data and what benefits XR may have for your application. For example, are you trying to show changes in riverbed morphology, requiring you to render many digital elevation models? Or are you looking at slow geophysical processes, with 3D slices of complex imagery representing your data?
In ESS, creating XR applications involves using scientific data to design 3D experiences that are deployed on one or more hardware platforms. Determining appropriate visualization methods and hardware requires thinking deeply about your specific data and what information or insights you want to glean. Common visualization techniques include 3D slices, extrusions, point clouds, and isosurfaces (Table 2). XR games can also be great sources of inspiration in spatial analyses.
Table 2. XR Visualization Techniques for Volumetric Data Analysis
| Visualization Techniques for Volumetric Data Analysis | Good Usage Examples |
| 3D slices | Describing multi-instrument/measurement systems, model couplings, cross-sectional analyses, tomography |
| 3D lines and arrows | Satellite tracks, magnetic field lines or field-aligned data, flows and gradients |
| Extrusions | Layered data and their boundaries, topography and digital elevation models |
| Isosurfaces | Fluids, tomography |
| Point clouds (voxels) | Fluids, lidar scans, satellite data such as attitude and tracks, satellite point measurements (Global Navigation Satellite Systems (GNSS), magnetic fields) |
| Immersive space | Perspective- or scale-sensitive observations such as all-sky imaging, spatially or directionally sensitive systems such as field trips |
Before beginning to develop a new XR experience, you must convert your raw data from instruments or simulations into a 3D format. The memory requirements posed by large datasets offer common challenges for such conversions, but they can be addressed by converting data to more portable formats such as GLB and USDZ.
With 3D data in hand, you may want to start visualizing them by using existing XR programs that don’t require additional coding. Free visualizers are available for most standard 3D file formats. Just seeing the data in a 3D environment, even if not a custom one, may offer new perspectives and spark useful conversations. Existing tools enable morphological comparisons, integration of data from multiple datasets, and other capabilities.
If you want to develop a bespoke visualization specific to your data, integrate data processing into your XR application, or visualize something abstract (like a toy model), you will need to build a custom application using a game engine such as Unreal Engine or Unity. With these resources, developers can build interfaces to facilitate interaction with data and with multiple users. Developing a robust user interface is crucial to the success of an XR application, and it is best undertaken in collaboration with colleagues knowledgeable in user interface design.
The process of going from raw data to a full XR application, a research front in its own right, is often nonlinear. Technical challenges in 3D visualization include problems accurately depicting morphologies or scaling, the occurrence of data occlusions or limited fields of view, the creation of ambiguous geometries or unclear intersections among data, and difficulties representing complex systems or dealing with inconsistent data formats. Future developments in XR, to the point where scientists can conduct research in 3D, must address these challenges. Needed advancements include improvements in interactivity (e.g., on-demand geometric transformations and slicing), 3D mathematical analyses (e.g., true 3D filters and spectral analysis), validation (e.g., ensuring clearly discernible geometric relations, scales, and positions), and discovery (e.g., capabilities for identifying patterns, structures, and correlations).
Acknowledgments
We thank our colleagues who have helped us lead XR-themed scientific conference sessions in the past, as well as our collaborators in XR projects, including Nick Hedley, Jaqueline Ryan, Robert LiKamWa, Joe Roberts, Beverly French, Jennifer Hoey, Jared Bendis, Andrew Rossi, Anne Holland, and others. This work is supported by National Science Foundation grant OPP-2218996.
References
Bailenson, J. (2019), Experience on Demand: What Virtual Reality Is, How It Works, and What It Can Do, WW Norton, New York, wwnorton.com/books/experience-on-demand/.
Boghosian, A. L., et al. (2019), Inside the ice shelf: Using augmented reality to visualise 3D lidar and radar data of Antarctica, Photogramm. Rec., 34(168), 346–364, https://doi.org/10.1111/phor.12298.
Bursztyn, N., et al. (2022), Virtual strike and dip—Advancing inclusive and accessible field geology, Geosci. Commun., 5(1), 29–53, https://doi.org/10.5194/gc-5-29-2022.
Carabajal, I. G., and C. L. Atchison (2020), An investigation of accessible and inclusive instructional field practices in US geoscience departments, Adv. Geosci., 53, 53–63, https://doi.org/10.5194/adgeo-53-53-2020.
Dede, C. (2009), Immersive interfaces for engagement and learning, Science, 323(5910), 66–69, https://doi.org/10.1126/science.1167311.
Gallagher, C., S. Turkay, and R. A. Brown (2022), Towards designing immersive geovisualisations: Literature review and recommendations for future research, in OzCHI ’21: Proceedings of the 33rd Australian Conference on Human-Computer Interaction, pp. 307–326, Assoc. for Comput. Mach., New York, https://doi.org/10.1145/3520495.3520511.
Grubb, T., et al. (2023), Using XR for improving scientific discovery with numerical weather models, in IGARSS 2023 – 2023 IEEE International Geoscience and Remote Sensing Symposium, pp. 1,537–1,540, IEEE, Piscataway, N.J., https://doi.org/10.1109/IGARSS52108.2023.10282886.
Lanier, J. (2017), Dawn of the New Everything: Encounters with Reality and Virtual Reality, Henry Holt, New York, us.macmillan.com/books/9781250097408/dawnoftheneweverything/.
Lu, Q., and M. L. Rudolph (2024), A synoptic view of mantle plume shapes enabled by virtual reality, Geochem. Geophys. Geosyst., 25(6), e2024GC011517, https://doi.org/10.1029/2024GC011517.
Seers, T. D., et al. (2022), Virtual outcrop geology comes of age: The application of consumer-grade virtual reality hardware and software to digital outcrop data analysis, Comput. Geosci., 159, 105006, https://doi.org/10.1016/j.cageo.2021.105006.
Tack, N., et al. (2023), Development and initial testing of XR-based fence diagrams for polar science, in IGARSS 2023 – 2023 IEEE International Geoscience and Remote Sensing Symposium, pp. 1,541–1,544, IEEE, Piscataway, N.J., https://doi.org/10.1109/IGARSS52108.2023.10281776.
Turkle, S. (2005), The Second Self: Computers and the Human Spirit, MIT Press, Cambridge, Mass., https://doi.org/10.7551/mitpress/6115.001.0001.
Zhang, Z., et al. (2026), Using virtual reality to study human response to flood risk across controlled experiments, Int. J. Disaster Risk Reduct., 132, 105956, https://doi.org/10.1016/j.ijdrr.2025.105956.
Author Information
Kristina Collins ([email protected]), Space Science Institute, Boulder, Colo.; Alexandra Boghosian, Lamont-Doherty Earth Observatory, Palisades, N.Y.; and Jaime Aguilar Guerrero, Embry-Riddle Aeronautical University, Daytona Beach, Fla.