Between 2011 and 2015, oceanographers released more than 150 acoustically tracked floats throughout the Gulf of Mexico, where they followed the ocean currents 1,500 meters below the surface. The scientists tracked these floats using an array of sound sources, moored to the ocean floor, which emitted low-frequency tones that the floats picked up with their built-in hydrophones [Hamilton et al., 2016].
Currents below the surface are critical to predicting the evolution of the Loop Current system, which strongly influences hurricane development and how oil spills spread.
It’s now relatively easy to monitor surface currents like the Gulf of Mexico’s Loop Current and its associated eddies and to track how these currents evolve using satellites. However, the currents below the surface are more challenging to observe. But observe them we must because they are critical to predicting the evolution of the Loop Current system, which strongly influences hurricane development and how oil spills spread.
Oceanographers routinely deploy different types of drifting instruments in the ocean to track the movement of currents on and below the surface and measure changes in properties such as water temperature and salinity along their drifting path.
Surface floats can be tracked continuously via GPS. Profiling floats drift untracked at depth; every 10 days or so, they rise to the surface to get their position from GPS and transmit data they collected during their ascent. A third type of float, the acoustically tracked floats we describe here, goes about its business on its own, saving the data it collects for months to years, after which it pops to the surface and transmits its data to satellites overhead.
Nearly 50 years ago, scientists developed a technique for long-range acoustic float tracking to trace out the intricate pathways of ocean currents below the surface. Since then, thousands of acoustically tracked floats have been deployed to measure currents in many regions of the global ocean. Their high-resolution trajectories have revealed a rich diversity of energetic water motions far below the sea surface.
We have recently created a new archive of all acoustically tracked float data to provide better public access to this unique and valuable resource. In 2017, we established a new repository for all acoustically tracked subsurface float data at the National Oceanic and Atmospheric Administration’s Atlantic Oceanographic and Meteorological Laboratory (AOML). The new repository is an updated, quality-controlled, streamlined version of the data set previously stored at the World Ocean Circulation Experiment Float Data Assembly Center (WFDAC).
Acoustic Float Tracking in the Deep Ocean
The extreme hydrostatic pressures and the inability of light to penetrate below the near-surface layer have made it challenging to observe deep-ocean currents. Acoustically tracked floats help to address this challenge by providing information about the speed and direction of currents along their path (this is called a Lagrangian approach). Ever since scientists developed the capabilities to acoustically track these deep-sea floats over long ranges (thousands of kilometers), with high resolution (as fine as several kilometers) [Rossby and Webb, 1970], oceanographers have been able to observe complex subsurface currents in the same way that GPS-tracked surface floats are used to describe surface currents on a wide range of spatial and temporal scales [Richardson, 2009; Rossby, 2016].

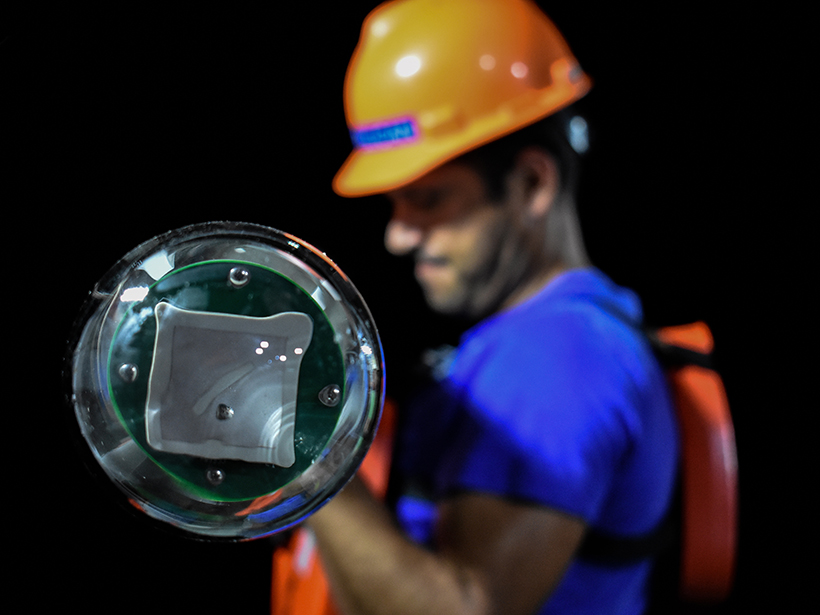
Today’s acoustic float observing system consists of a basin-wide or regional array of at least three moored low-frequency sound sources and a fleet of floats (Figure 1) [Rossby et al., 1986], ballasted to drift at constant pressure or density for as long as several years. A microprocessor in each float is programmed to listen for the sound sources at intervals from 6 to 48 hours, depending on the desired trajectory resolution, and to record the times of arrival (TOAs) of the acoustic signals. Temperature and pressure measurements are made on the same sampling schedule.
At the end of the mission, the float returns to the surface and transmits the stored data via the Iridium satellite network. After the mission, the TOAs are converted to acoustic travel times from source to float, and these travel times are used to calculate distance using the speed of sound in seawater. The float position at each time step is determined on the basis of the intersection of range circles from each sound source.
The float trajectories have produced fundamental revelations regarding the importance of mesoscale turbulence—or eddies—in the transport of properties and energy in the ocean. These floats are presently the only tool available to measure ocean currents with high spatial resolution at any depth in the water column. A single float track can reveal an unknown feature of the deep circulation, whereas larger numbers of float trajectories can be combined to quantify dispersion and other statistical properties of motion in the deep ocean.
Discoveries with Acoustically Tracked Floats

In the late 1970s, a research group from the University of Rhode Island used acoustically tracked floats to reveal energetic subsurface coherent vortices (eddies), starting with observations of a lens-shaped layer of warm, salty water near the Bahamas. This layer had a diameter of some 100 kilometers, and it was centered at a depth of about 1,000 meters, spinning clockwise with a rotation period of 12 days [McDowell and Rossby, 1978]. The temperature and salinity in the eddy core indicated that it had probably formed some 6,000 kilometers away, where outflow from the Mediterranean Sea enters the North Atlantic. These observations allowed the researchers to identify these eddies (named “Meddies”) as a new long-distance transport mechanism in the ocean.
Acoustically tracked floats have also been used to describe the kinematics and dynamics of the eddy-rich Gulf Stream, North Atlantic Current, California Undercurrent, and Agulhas Current. They have demonstrated distinctions between the interior and boundary pathways of Labrador Sea Water from the subpolar to subtropical North Atlantic. These floats have also provided insight into the structure and pathways of the Deep Western Boundary Current, dispersion in the Antarctic Circumpolar Current, and more.
Surveying the Gulf of Mexico’s Deep Currents
The 2011–2015 Gulf of Mexico study illustrates the unique capabilities of acoustically tracked floats to observe the velocity field of the subsurface ocean on a wide range of spatial scales.

These floats were unable to escape from the gulf easily, so they provided dense sampling of the deep currents throughout the basin (Figure 2a). By grouping the float velocities in geographic boxes and averaging them, a clear pattern of deep currents emerged, including a counterclockwise narrow boundary current encircling most of the gulf, a deep counterclockwise gyre over the deepest part of the basin, and several mesoscale features under the Loop Current in the eastern gulf (Figure 2b) [Pérez-Brunius et al., 2018].
The strength of the velocity variability, or eddy kinetic energy, was 4 times larger under the Loop Current than it was in other subsurface regions, indicating a coupling between the upper and lower layers of the eastern gulf (Figure 2c). Using a mathematical technique called wavelet analysis, Furey et al. [2018] also discovered a population of deep coherent vortices, including a new Meddy-like eddy formation process from the boundary current in the western gulf (Figure 2a). These fluid-trapping eddies were not detectable on the surface: Their very existence would be completely unknown without these float observations.
A New Repository for Acoustically Tracked Float Data
The new database contains float data with a high temporal resolution (sampling periods between 6 and 48 hours), collected using the early Sound Fixing and Ranging (SOFAR) floats (which emit signals that can be detected by hydrophones at fixed locations), RAFOS floats (SOFAR backward because these floats receive sound signals rather than send them), and profiling floats tracked acoustically while drifting at depth.
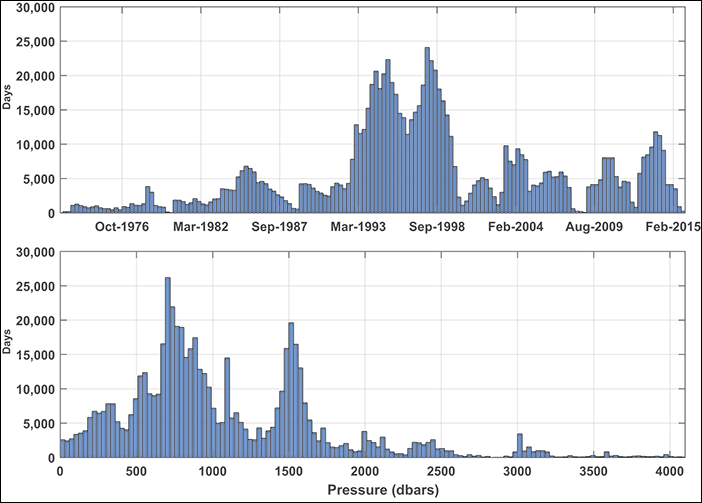
Most important, we have significantly expanded the database by adding new float data. This addition increased the archive of float projects from 29 to 51, expanding the total number of individual float trajectories from 1,248 to 2,197: an increase of 76%. The trajectories of all floats in the archive and their distribution in time and depth are shown in Figures 3 and 4.

This comprehensive database replaces the WFDAC data archive, and it can be downloaded in an easily accessible, consistent, and concise format from AOML’s website. The data are available in NetCDF and MATLAB “mat-file” format, and they are searchable by region and depth, among other parameters. This archive will continually grow as researchers collect and add new float data.
Creating and maintaining a single, comprehensive, and internally consistent archive will facilitate continued analysis of this unique and valuable resource, allowing more comprehensive regional and depth-dependent comparisons of velocity statistics. These analyses will prove invaluable for validating numerical model simulations and advancing our understanding of the physical mechanisms that determine the character of the deep-ocean circulation.
References
Furey, H., et al. (2018), Deep eddies in the Gulf of Mexico observed with floats, J. Phys. Oceanogr., https://doi.org/10.1175/JPO-D-17-0245.1.
Hamilton, P., et al. (2016), Deep circulation in the Gulf of Mexico: A Lagrangian study, OCS Study BOEM 2016-081, 289 pp., Gulf of Mexico OCS Region, Bur. of Ocean Energy Manage., U.S. Dep. of the Inter., New Orleans, La., https://www.boem.gov/ESPIS/5/5583.pdf.
McDowell, S. E., and H. T. Rossby (1978), Mediterranean water: An intense mesoscale eddy off the Bahamas, Science, 202, 1,085–1,087, https://doi.org/10.1126/science.202.4372.1085.
Pérez-Brunius, P., et al. (2018), Dominant circulation patterns of the deep Gulf of Mexico, J. Phys. Oceanogr., 48, 511–529, https://doi.org/10.1175/JPO-D-17-0140.1.
Richardson, P. L. (2009), Drifters and floats, in Measurement Techniques, Sensors and Platforms: A Derivative of Encyclopedia of Ocean Sciences, 2nd ed., edited by J. H. Steele, S. A. Thorpe, and K. K. Turekian, pp. 171–178, Academic, London, https://doi.org/10.1016/B978-012374473-9.00732-3.
Rossby, T. (2016), Visualizing and quantifying oceanic motion, Annu. Rev. Mar. Sci., 8, 7.1–7.23, https://doi.org/10.1146/annurev-marine-122414-033849.
Rossby, T., and D. Webb (1970), Observing abyssal motions by tracking Swallow floats in the SOFAR Channel, Deep Sea Res., 15, 359–365, https://doi.org/10.1016/0011-7471(70)90027-6.
Rossby, T., D. Dorson, and J. Fontaine (1986), The RAFOS system, J. Atmos. Oceanic Technol., 3, 672–679, https://doi.org/10.1175/1520-0426(1986)003%3C0672:TRS%3E2.0.CO;2.
Author Information
Andrée L. Ramsey (email: [email protected]), Heather H. Furey, and Amy S. Bower, Woods Hole Oceanographic Institution, Mass.
Citation:
Ramsey, A. L.,Furey, H. H., and Bower, A. S. (2018), Deep floats reveal complex ocean circulation patterns, Eos, 99, https://doi.org/10.1029/2018EO105549. Published on 05 November 2018.
Text © 2018. The authors. CC BY-NC-ND 3.0
Except where otherwise noted, images are subject to copyright. Any reuse without express permission from the copyright owner is prohibited.