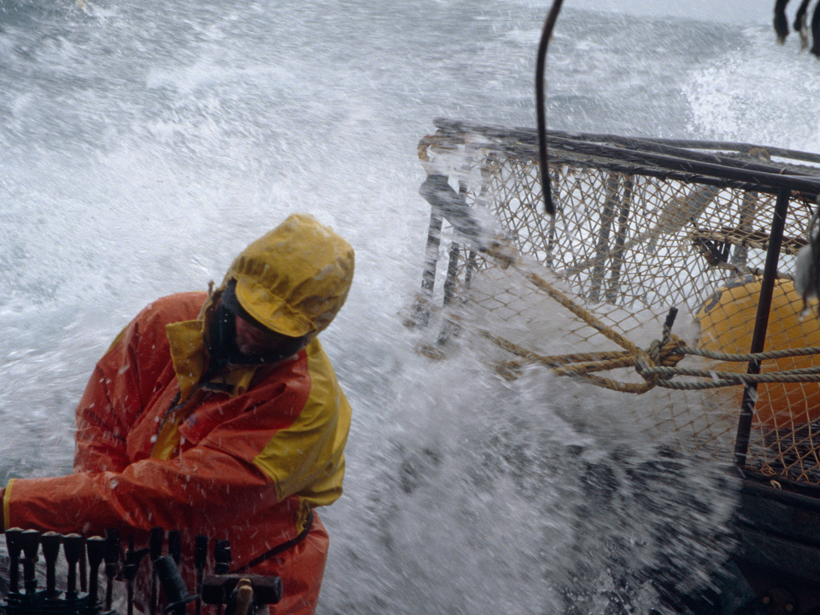
Along the Alaskan coast, strong, low-level winds flow through mountain gaps and high-walled bays. These “gap flow winds” can vary dramatically over short distances, and they present a significant hazard to boats and aircraft.
The National Oceanic and Atmospheric Administration (NOAA) now has the capability to map these winds and other localized wind patterns over the ocean using satellite imagery created by synthetic aperture radar (SAR). Using this capability, NOAA developed a data product called SAR Winds, which provides daily updates of gap flow wind speeds over the polar regions. SAR Winds also provides updates of wind speeds along other U.S. coasts but only when satellite data for those locations are available.
With the data, coastal managers can better anticipate hazards and risks, monitor pollution spills, and coordinate search and rescue efforts.
But creating daily maps of wind patterns over Alaska is just the beginning: SAR Winds aims to provide near-real-time data for all U.S. coasts. Armed with these data, coastal managers can better anticipate hazards and risks, monitor pollution spills, and coordinate search and rescue efforts.
From Radar Reflections to Wind Speeds
High-resolution radar imagery requires large antennas. SAR systems are typically mounted on an aircraft or satellite. They create the equivalent of a very large aperture by recording the reflected radar data while in flight.
Two phenomena are key to translating radar images to wind speed measurements. First, the ocean becomes rougher as wind speed increases, and the roughness is aligned with the wind direction. Second, as the ocean surface gets rougher, the radar reflectivity increases. One measure of this reflectivity is the normalized radar cross section (NRCS) [Wright, 1960].
Geophysical model functions relate wind speed and direction to the corresponding NRCS [Stoffelen and Anderson, 1997; Hersbach, 2010]. In these model functions, a specific NRCS measurement can correspond to several different wind speed and direction pairs. However, if wind direction is known, the wind speed can be computed from the NRCS value. The SAR wind processing uses the wind direction from a numerical weather model to uniquely identify the wind speed for a measured NRCS.
Building from a Long History
The measurement of wind speed from SAR imagery enjoys a long heritage. Wind speed data were inferred from the Seasat SAR, the first civilian spaceborne SAR, launched in 1978 [Weissman et al., 1979].
From 1995 to 2010, NOAA used imagery from Canada’s Radarsat-1 to regularly derive wind speed maps as part of its Alaska SAR Demonstration Project (1999), where Radarsat-1 data were downloaded at the Alaska Satellite Facility in Fairbanks and processed into wind speed maps within a few hours from acquisition. This project permitted the validation of SAR wind speed measurements against both buoy and NASA’s QuikSCAT scatterometer measurements, showing a standard deviation smaller than 2 meters per second [Monaldo et al., 2004].
The product has a demonstrated set of users, and NOAA makes special efforts to maintain availability and provide the data in as near real time as possible.
SAR Winds builds from this long history. Through the SAR Winds system, NOAA produces high-resolution maps of wind speeds over the ocean. These maps can image features down to a resolution of 500 meters.
At this resolution, SAR Winds observes fine-scale wind patterns on the surface of the ocean at the coasts. The high resolution reveals features not observable in other data sets or represented in current models.
SAR Winds became NOAA’s first operational SAR-based product in May 2013. Operational here means that the product has a demonstrated set of users and that NOAA makes special efforts to maintain availability and provide the data in as near real time as possible.
An Abundance of Images
SAR Winds first started making maps of Alaska’s coast using SAR imagery from Canada’s Radarsat-2, obtained by NOAA’s National Ice Center (NIC). NIC monitors the polar sea ice extent and determines associated ice hazards to navigation. NIC’s Radarsat-2 imagery yields about 4000 images per year—these images are sent to SAR Winds for further processing to make them user friendly. Then they are distributed by NOAA’s Office of Satellite and Product Operations.
SAR Winds will take advantage of the large volume of SAR imagery expected from the European Space Agency’s (ESA) Sentinel-1 satellites. Sentinel-1A, which launched 3 April 2014, acquires approximately 26 minutes of imagery during each orbit. An identical Sentinel-1B SAR satellite is slated for launch in 2016.
ESA has a “free and open” data policy for Sentinel-1 imagery. Since October 2014, ESA has made available “preliminarily qualified” Sentinel-1A imagery via its public Scientific Data Hub. Roughly 100 images a day are being converted to SAR Winds products for system evaluation and product validation. Thus far, Sentinel-1A observations, when integrated into SAR Winds, perform with an accuracy similar to that of the Radarsat-2 data.
In the future, NOAA anticipates becoming an international partner of the Sentinel satellites and obtaining Sentinel-1A imagery via a high-speed data link to support SAR Winds processing with near-real-time delivery of around 3 hours. NOAA’s initial priority is to produce SAR Winds products for Sentinel-1A data acquired within 500 kilometers of the U.S. coasts, over the Great Lakes, and in the polar regions.
Wind Maps off Alaska’s Coast
Currently, the principal output of SAR Winds is a Network Common Data Form (NetCDF) file that’s climate-forecast compliant, meaning that it contains an agreed-upon set of metadata that promotes sharing and use of geophysical information.
The file includes layers for SAR-derived wind speed, Global Forecast System (GFS) model wind speed and direction, a land mask, longitude, latitude, radar look direction, and incident angle.
Images produced over the Arctic region include an ice mask layer from the Interactive Multisensor Snow and Ice Mapping System [Helfrich et al., 2007]. The ice mask assists in validation by flagging locations where wind speeds are derived from ice pixels rather than over the ocean. Wind speeds over ice masses can be excluded from the calculations using the mask.
For a sample SAR Winds map, see Figure 1. The National Weather Service, especially local forecast offices in the Alaska region, has taken an interest in using images from SAR Winds, such as those similar to Figure 1. These offices use the SAR Winds images to assist analysts in their forecasts.

Validating Operational Products
Validation is an important component of the operational SAR Winds system. SAR wind speed accuracy is estimated by comparing the retrieved SAR winds against independent wind speed estimates.
For the period between 21 December 2014 and 17 March 2015, 87,497 comparisons were made between Sentinel-1A-derived SAR winds and spatially coincident wind retrievals from NOAA’s Advanced Scatterometer (ASCAT; taken within ±2 hours of the Sentinel-1A observation time). Most of these comparisons were in polar regions at latitudes north of 60°N but south of the ice edge.
The SAR wind retrievals were averaged into 25 kilometer × 25 kilometer areas to match the ASCAT lower-resolution scatterometer measurement. The mean difference between Sentinal-1A and ASCAT winds was −0.45 meters per second, with a standard deviation of 1.82 meters per second. These results are comparable to the validation results from Radarst-2 (mean difference of −0.60 meters per second and standard deviation of 1.51 meters per second [Monaldo et al., 2013]). For details of the comparison, see Monaldo et al. [2015].
Once Sentinel-1A ramps up to full operations, we also intend to make direct Sentinel-1A and Radarsat-2 comparisons.
More Applications to Come
Now that NOAA has successfully created regular Radarsat-2 SAR Winds images that can be used by coastal managers, NOAA has plans to produce additional SAR-based products. These plans will be aided by the integration of the large volumes of SAR imagery expected from Sentinel-1 and the Canadian Radarsat Constellation Mission (2018).
Future products are expected to include an automated sea ice masking and classification, ship detection, oil spill mapping, and ocean wave spectra.
Future products, now undergoing preliminary tests, are expected to include an automated sea ice masking and classification, ship detection, oil spill mapping, and ocean wave spectra. As each product is validated, it will be incorporated into routine dissemination systems. NOAA expects that the availability of free and open Sentinel-1 SAR imagery from ESA will greatly accelerate and expand the development of new applications of SAR.
Acknowledgments
This work is supported by the NOAA Product Development, Readiness and Application (PDRA)/Ocean Remote Sensing (ORS) Program. The views, opinions, and findings contained in this paper are those of the authors and should not be construed as an official NOAA or U.S. government position, policy, or decision. The strong and continued support of the Alaska Weather Service and ice forecasters at the U.S. National Ice Center was key in making SAR Winds an operational NOAA product.
References
Helfrich, S. R., D. McNamara, B. H. Ramsay, T. Baldwin, and T. Kasheta (2007), Enhancements to, and forthcoming developments in the Interactive Multisensor Snow and Ice Mapping System (IMS), Hydrol. Processes, 21, 1576–1586.
Hersbach, H. (2010), Comparison of C-band scatterometer CMOD5.N equivalent neutral winds with ECMWF, J. Atmos. Oceanic Technol., 27, 721–736, doi:10.1175/2009JTECHO698.1.
Monaldo, F. M., V. Kerbaol, and the SAR Wind Team (2004), The SAR measurement of ocean surface winds: An overview, in Proceedings of the Second Workshop on Coastal and Marine Applications of SAR, Eur. Space Agency Spec. Publ., ESA SP-565, 15–32.
Monaldo, F. M., C. R. Jackson, and W. G. Pichel (2013), Seasat to Radarsat-2: Research to operations, Oceanography, 26(2), 34–45.
Monaldo, F. M., C. R. Jackson, W. G. Pichel, and X. Li (2015), Early validation of operational SAR wind retrievals from Sentinel-1A, paper presented at IEEE Geoscience and Remote Sensing Symposium, Inst. of Electric. and Electron. Eng., Milan, Italy, 26–31 July.
Stoffelen, A. C. M., and D. L. T. Anderson (1997), ERS-1 scatterometer data characteristics and validation of the transfer function: CMOD4, J. Geophys. Res., 102, 5767–5780.
Weissman, D. E., D. King, and T. W. Thompson (1979), Relationship between hurricanes surface winds and L-band radar backscatter from the sea surface, J. Appl. Meteorol., 18, 1023–1034.
Wright, J. W. (1960), Backscattering from capillary wave with application to sea clutter, IEEE Trans. Antennas Propag., 14, 749–754.
Author Information
F. M. Monaldo, Applied Physics Laboratory, National Oceanic and Atmospheric Administration (NOAA) and Johns Hopkins University, College Park, Md.; email: [email protected]; C. R. Jackson, Global Science and Technology (GST), NOAA, College Park, Md.; W. G. Pichel, NOAA, College Park, Md., retired; and X. Li, GST, NOAA, College Park, Md.
Citation: Monaldo, F. M., C. R. Jackson, W. G. Pichel, and X. Li (2015), A weather eye on coastal winds, Eos, 96, doi:10.1029/2015EO034581. Published on 1 September 2015.
Text © 2015. The authors. CC BY-NC 3.0
Except where otherwise noted, images are subject to copyright. Any reuse without express permission from the copyright owner is prohibited.