
Magnetic measurements at or near the Earth’s surface detect fields from several sources. More than 90% of the signal comes from the main geomagnetic field, which resembles a great central magnetic dipole tilted by about 9.5° with respect to the Earth’s rotation axis [Thébault et al., 2015]. The rest can be explained by external fields and magnetic minerals in the lithosphere—Earth’s crust and uppermost mantle layer.
Scientists think of this nearly 10% contribution as a perturbation of the main field, a bit of magnetic “noise,” and they refer to these small disturbances as “magnetic anomalies.” However, maps of these anomalies provide a view of the crust and possibly of the uppermost mantle.
Magnetic anomaly maps provide information regarding the thermal structure of the Earth’s lithosphere, its plate tectonic history, and the location and distribution of natural resources.
Magnetic anomaly maps provide information regarding the thermal structure of the Earth’s lithosphere, plate tectonic history of the past 160 million years, and the location and distribution of natural resources (large deposits of iron ore, for example).
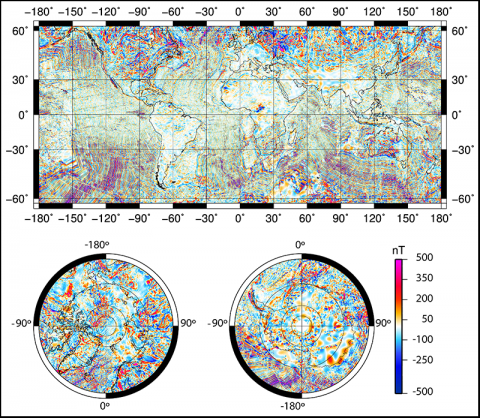
The World Digital Magnetic Anomaly Map (WDMAM) project is an international scientific effort, a joint initiative of the International Association of Geomagnetism and Aeronomy (IAGA) and the Commission for the Geological Map of the World. The main objective of this project is to construct the magnetic anomaly picture of our planet using data collected by geological surveys and government agencies, academic institutions, and industry. The newest version of the WDMAM (available at the WDMAM website) was released during the most recent International Union of Geodesy and Geophysics General Assembly, held in Prague in June–July 2015 (Figure 1).
Information in Anomalies
Magnetic anomalies reflect two properties of rocks. Magnetic susceptibility represents the ability of a rock to be magnetized in the presence of a magnetic field, and it results in field-dependent induced magnetization. Remanent magnetization is a permanent magnetic characteristic acquired by the rock at the time of its formation. Both properties vary with the type of rocks and are stronger for volcanic rocks.
Magnetic properties are closely related to temperature, which increases with depth in the lithosphere. Each type of rock or mineral has a characteristic temperature called the Curie temperature (for magnetite, the most common magnetic mineral on Earth, the Curie temperature is 580°C). Above this temperature, rocks lose their magnetization.
Thus, magnetic measurements only give access to lithospheric structure and processes shallower than the depth at which this temperature is reached. For instance, as new oceanic crust forms at spreading centers, it cools and acquires remanent magnetization aligned with the direction of the Earth’s magnetic field. Magnetic anomaly maps reveal patterns related to the polarity reversals of the Earth’s field and allow researchers to date the oceanic lithosphere, allowing reconstruction of the plate motion history.
Evolution of a Global Map for Magnetic Anomalies
Since the early 1970s, global magnetic anomaly maps from satellite data have provided better knowledge and understanding of the Earth’s interior and environment.
Magnetic anomaly maps derived from satellite data cover the entire world uniformly. However, satellites take data only at long wavelengths. The WDMAM aims to provide mapping at a higher resolution, but it depends on the availability of surface data, so coverage is uneven across geographical regions.
The first version of the WDMAM was published in 2007 [Korhonen et al., 2007]. It was a tremendous effort, involving many scientists from different countries. Nevertheless, the initial version lacked data in many areas—in particular Africa, South America, and oceans in the Southern Hemisphere.
The new version of WDMAM was made possible by newly gathered data and the application of new processing schemes to improve its internal coherency. New or updated compilations were added, including the fifth edition of the Magnetic Anomaly Map of Australia [Milligan et al., 2010] and the new Arctic compilation [Gaina et al., 2011], to name only a few.
We achieved an important step forward on mapping the oceans by including additional data from the Geophysical Data System (GEODAS) database. We included data from individual oceanographic institutions, and we digitized old analog marine data [Ishihara et al., 2013]. Data gaps in oceanic areas were filled using a new marine magnetic anomaly model. This model is based on the age of the oceanic lithosphere and the geomagnetic polarity time scale, taking into account the remanent magnetization vector direction and adjusted to the available data [Dyment et al., 2015].
The new magnetic anomaly map has 3 minutes of arc spacing resolution, the same as the previous map [Lesur et al., 2016]. The data are represented at 5 kilometers above sea level on the continents and at sea level on the oceans. Because of the uneven coverage of the data, the long-wavelength content of the aeromagnetic and marine data was removed and replaced by that of the GRIMM_L model, a lithospheric magnetic representation derived from the Challenging Minisatellite Payload (CHAMP) satellite data up to spherical harmonic 120 [Lesur et al., 2013]. This lithospheric magnetic model was also used to fill in remaining data gaps. An index map allows the user to distinguish among data from different origins.
A Deeper Understanding
A magnetic anomaly map provides information on the distribution of magnetization contrasts, which, in turn, provides insight into the processes that formed various structures in Earth’s lithosphere (and possibly into the uppermost mantle). The WDMAM, with its global coverage, offers a continent-scale perspective, which makes possible a more comprehensive and robust interpretation of geological structures, including areas that are covered in ice or sediment.
The new version of the World Digital Magnetic Anomaly Map relies on newly gathered data and the application of new processing schemes to improve its internal coherency.
This map provides a deeper understanding of our planet that cannot be captured through other conventional global data sets, and it offers a unique window to the geodynamic history of our planet.
Acknowledgments
We thank the colleagues who participated in the acquisition, processing, gathering, and conservation of magnetic data. We are grateful to the institutions and individuals, listed on the WDMAM website, who contributed to making the WDMAM a reality by providing data.
References
Dyment, J., Y. Choi, M. Hamoudi, V. Lesur, and E. Thebault (2015), Global equivalent magnetization of the oceanic lithosphere, Earth Planet. Sci. Lett., 430, 54–65, doi:10.1016/j.epsl.2015.08.002.
Gaina, C., S. C. Werner, R. Saltus, S. Maus, and the CAMP-GM Group (2011), Circum-Arctic mapping project: New magnetic and gravity anomaly maps of the Arctic, in Arctic Petroleum Geology, Mem. Geol. Soc. London, vol. 35, edited by A. M. Spencer et al., pp. 39–48, Geol. Soc., London.
Ishihara, T., M. Catalán, and S. Maus (2013), Digitization of low-altitude Project Magnet data, paper presented at XII IAGA Scientific Assembly, Int. Assoc. of Geomagn. and Aeron., Mérida, Mexico.
Korhonen, J. V., et al. (2007), Magnetic Anomaly Map of the World, Comm. for Geol. Map of the World, Paris.
Lesur, V., M. Rother, F. Vervelidou, M. Hamoudi, and E. Thébault (2013), Post-processing scheme for modeling the lithospheric magnetic field, Solid Earth, 4, 105–118, doi:10.5194/se-4-105-2013.
Lesur, V., M. Hamoudi, Y. Choi, J. Dyment, and E. Thébault (2016), Building the second version of the World Digital Magnetic Anomaly Map (WDMAM), Earth Planets Space, 68, 27, doi:10.1186/s40623-016-0404-6.
Milligan, P. R., R. Franklin, B. R. S. Minty, L. M. Richardson, and P. J. Percival (2010), Magnetic Anomaly Map of Australia, 5th ed., scale 1:15,000,000, Geosci. Australia, Canberra.
Thébault, E., et al. (2015), International Geomagnetic Reference Field: The 12th generation, Earth Planets Space, 67, 79.
Author Information
Manuel Catalán, Seccion de Geofisica, Real Instituto y Observatorio de la Armada, Cadiz, Spain; email: [email protected]; Jérôme Dyment and Yujin Choi, Institut de Physique du Globe de Paris and Centre National de la Recherche Scientifique, Paris, France; Mohamed Hamoudi, University of Science and Technology Houari Boumediene, Bab Ezzouar, Algeria; Vincent Lesur, Institut de Physique du Globe de Paris, Paris, France; Erwan Thébault, Université de Nantes, Nantes, France; Angelo de Santis, Istituto Nazionale di Geofisica e Vulcanologia, Rome, Italy; Takemi Ishihara, Institute of Geology and Geoinformation, Geological Survey of Japan, Tsukuba, Japan; Juha Korhonen, Geological Survey of Finland, Espoo, Finland; Tamara Litvinova, A. P. Karpinsky Russian Geological Research Institute (VSEGEI), St. Petersburg, Russia; Joaquim Luis, Universidade do Algarve, Faro, Portugal; Brian Meyer, Cooperative Institute for Research in Environmental Science, Boulder, Colo.; Peter Milligan, formerly at Geoscience Australia, Canberra, ACT, Australia; Masao Nakanishi, Graduate School of Science, Chiba University, Chiba, Japan; Shigeo Okuma, Geophysics Research Group, Geological Survey of Japan, Tsukuba, Japan; Mark Pilkington, Geological Survey of Canada, Ottawa, Canada; Michael Purucker, Planetary Geodynamics Laboratory, NASA Goddard Space Flight Center, Greenbelt, Md.; Dhananjay Ravat, Department of Earth and Environmental Sciences, University of Kentucky, Lexington; Carmen Gaina, Centre for Earth Evolution and Dynamics, University of Oslo, Oslo, Norway; Stefan Maus, Cooperative Institute for Research in Environmental Sciences, NOAA David Skaggs Research Center, University of Colorado, Boulder; Yoann Quesnel, Centre Européen de Recherche et d’Enseignement de Géosciences de l’Environnement, Aix-Marseille University, Aix-en-Provence, France; Richard Saltus, U.S. Geological Survey, Lakewood, Colo.; and Patrick Taylor, Planetary Geodynamics Laboratory, NASA Goddard Space Flight Center, Greenbelt, Md.
Citation:
Catalán, M.,Dyment, J.,Choi, Y.,Hamoudi, M.,Lesur, V.,Thébault, E.,de Santis, A.,Ishihara, T.,Korhonen, J.,Litvinova, T.,Luis, J.,Meyer, B.,Milligan, P.,Nakanishi, M.,Okuma, S.,Pilkington, M.,Purucker, M.,Ravat, D.,Gaina, C.,Maus, S.,Quesnel, Y.,Saltus, R., and Taylor, P. (2016), Making a better magnetic map, Eos, 97, https://doi.org/10.1029/2016EO054645. Published on 27 June 2016.
Text © 2016. The authors. CC BY-NC-ND 3.0
Except where otherwise noted, images are subject to copyright. Any reuse without express permission from the copyright owner is prohibited.