
Wildfires and controlled burns place special demands on the people who decide where and when to deploy firefighters, how to keep controlled burns contained, and how best to protect life and property. Meteorologists from the National Weather Service weather offices, fire incident meteorologists, and state and local air quality forecasters provide information that is vital to assisting these decision makers. These meteorologists must determine the effects of smoke and quickly incorporate them into their forecasts related to visibility and air quality.
Fortunately, a new fire and smoke data resource from the National Oceanic and Atmospheric Administration (NOAA) makes a new generation of high-accuracy, high-resolution aerosol data products readily available to these forecasters. The new website, called enhanced Infusing satellite Data into Environmental Applications (eIDEA), gives meteorologists and other interested parties access to the latest generation of satellite aerosol products.
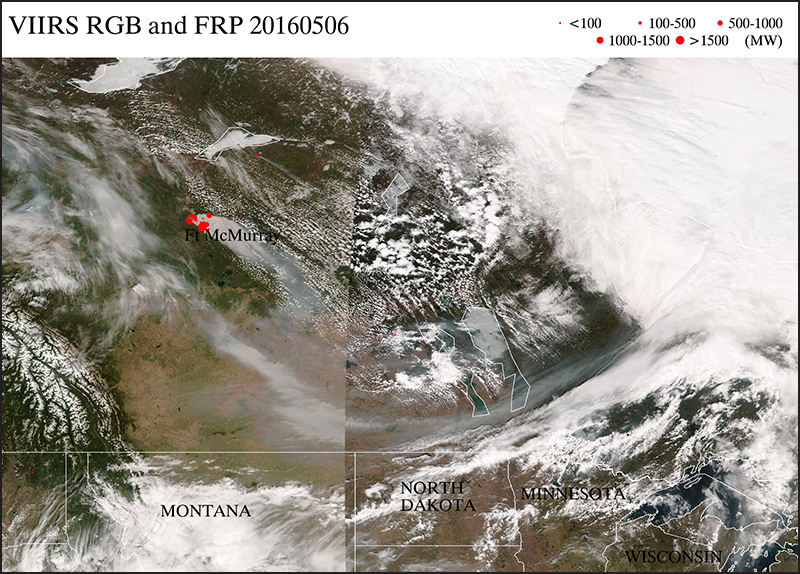
These new capabilities were put to the test last May, when a monthlong fire broke out in Fort McMurray in northeastern Alberta, Canada. The fire forced almost 88,000 people to evacuate their homes (Figure 1).
eIDEA: An Easy Interface for Data in Near Real Time
Observations made by the Visible Infrared Imaging Radiometer Suite (VIIRS) aboard NOAA and NASA’s Suomi National Polar-orbiting Partnership (NPP) Earth-observing satellite are used to generate eIDEA’s products and images. These VIIRS aerosol data products and images feature high accuracy and high spatial resolution, making them particularly useful for monitoring the effects of smoke from wildfires and controlled burns.
During the 2016 fire season, fire incident meteorologists and air quality forecasters used a new decision support tool to track the effects of wildfire emissions.
The eIDEA website was designed to specifically address the needs of forecasters, who require timely data and imagery in a simple, easy to use interface. The VIIRS instrument provides forecasters with a variety of aerosol products that feature multiple layers of information, all of which are available on eIDEA in near real time: less than 2 hours from when the data were collected.
The area covered by eIDEA spans the continental United States (CONUS), Alaska, and Canada; the domain will be expanded to include Mexico, Central America, and the Atlantic Ocean in the near future. During the 2016 fire season, fire incident meteorologists and air quality forecasters used this new decision support tool to track the effects of wildfire emissions.
Following the Smoke Signals
Because smoke has a very high concentration of aerosol particles, forecasters can use the information on eIDEA to track the geographic extent and transport of smoke plumes. One of the most useful data products on eIDEA is aerosol optical thickness (AOT), sometimes called aerosol optical depth. AOT is a measure of the scattering and absorption of visible light by particles in a vertical column of the atmosphere.
AOT is unitless and typically varies from 0 to 1 in the United States, although individual smoke plumes can have AOT values as high as 4. This data product is often represented by color codes in imagery, with cool colors (blues and greens) corresponding to lower AOT and warm colors (yellows, oranges, and reds) corresponding to higher AOT.
This measurement has certain limitations. Clouds block the measurement of AOT, so there are no measurements in cloudy regions, and data are not retrieved over areas covered by snow. AOT measures the total light absorption and scattering for a given air column, so it does not provide any information about the height of the aerosols within this column. Nor does it tell us how likely the particles are to reach the ground.
However, a NOAA trajectory product based on AOT measurements has proven useful in situations when forecasters need to predict how a smoke plume will affect surface conditions. In this trajectory product, AOT measurements serve as the basis for monitoring the plume vertically and horizontally as it moves forward through Earth’s atmosphere. Forecasts of a smoke plume’s forward trajectory are initiated in areas of high observed AOT (greater than 0.4), and they run 48 hours into the future in 3-hour time steps. The trajectory product on eIDEA maps the forward movement of the smoke plumes using a color-coded scale.
As the forecast maps change over time, the color coding helps forecasters track the flow of aerosol-laden air toward or away from the surface, as well as the smoke plume’s horizontal trajectory. Wind field vectors are plotted as white arrows to show wind direction and speed. The maps also show areas where precipitation is forecast since rain or snow can remove aerosol particles from the atmosphere.
NOAA’s trajectory product helps to predict the vertical movement of the smoke from aloft in the atmosphere down to ground level, which is very difficult to forecast.
NOAA’s trajectory product is vital to making smoke forecasts. Smoke particles can be at any height in the atmosphere, but they are usually lofted up above the surface as the smoke plume moves away from the fire. Once the smoke is aloft, it can be transported tens to hundreds of kilometers downwind. If the smoke stays aloft, it doesn’t affect ground-level air quality or visibility, although it can affect aircraft visibility. However, if some weather system downwind pulls or mixes the smoke plume to the surface, it can affect local air quality and visibility at that downwind location, far from the fire. The vertical movement of the smoke from aloft in the atmosphere down to ground level is very difficult to forecast, and this process is what the trajectories help to predict.
Another data product available from eIDEA is a VIIRS smoke mask, which gives a qualitative indication of smoke that originates from burning fires in the region or that has been transported to the region from upwind, providing a quick way to see the location and extent of smoke plumes. The smoke mask is derived using spectral and spatial threshold tests based on VIIRS measurements in the visible and infrared wavelengths.
VIIRS also senses the locations of fires as hot spots, represented in imagery by red dots on eIDEA. The sizes of these dots indicate the quantitative intensity of the fire as the VIIRS fire radiative power, and eIDEA provides an easy way to view these hot spots and track them over time.
Putting the Capabilities to Use for the 2016 Fort McMurray Fire
Last year’s Fort McMurray fire in northeastern Alberta is a case study in how the VIIRS aerosol products on eIDEA can provide information on smoke transport and its potential for affecting surface conditions. The fire started on 1 May 2016 and burned for more than a month, consuming more than 600,000 hectares and forcing the evacuation of almost 88,000 residents from the city of Fort McMurray in early May. By 6 May, thick smoke from the fire was moving southeastward toward the northern plains of the United States.
On 6 May, the eIDEA trajectory forecast (Figure 2) predicted that the Fort McMurray smoke plume would reach the northern plains states and mix down to the surface from aloft in the atmosphere on 7 May.
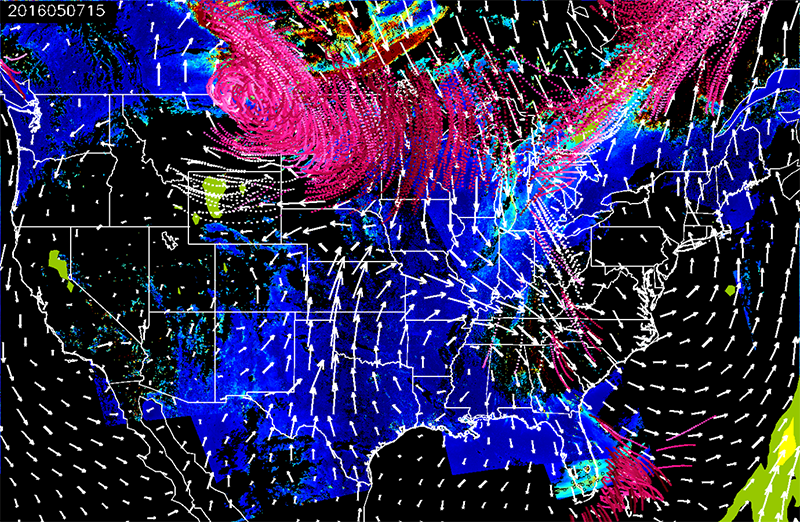
The trajectories forecast, presented on eIDEA as a dynamic animation, recalculates images in 3-hour increments; Figure 2 shows a snapshot from 7 May at 15:00 Coordinated Universal Time (UTC) as a representative example. The magenta and pink lines show the south and southeastward movement of the aerosol-rich plume, located over southern Saskatchewan and Manitoba on 6 May (red, orange, and yellow region). The magenta and pink colors of the trajectory lines indicate that the smoke plume would remain close to Earth’s surface as it moved into eastern Montana, North Dakota, South Dakota, Minnesota, and Iowa on 7 May.
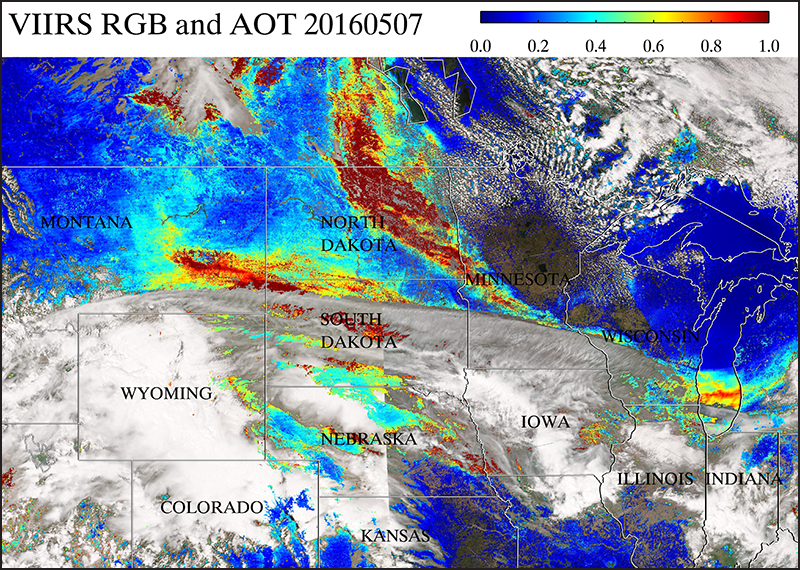
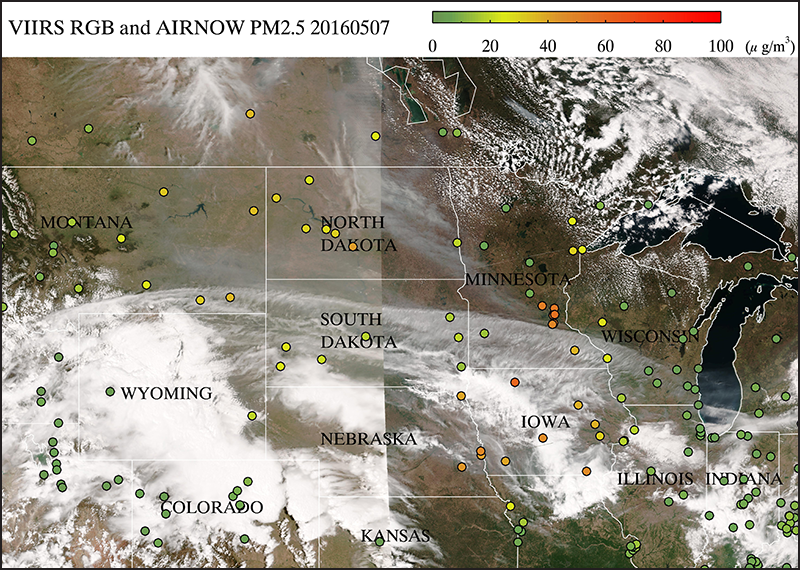
The VIIRS aerosol observations from eIDEA demonstrate that the trajectory predictions were accurate. Figure 3 shows plumes of high AOT associated with smoke from the Fort McMurray fire over the northern plains on 7 May. This transported smoke blanketed the ground surface; fine particulate matter exceeded National Ambient Air Quality Standards (NAAQS) across Iowa, Minnesota, eastern Nebraska, and North Dakota (Figure 4). Locations where smoke affected ground-level air quality are evident from this eIDEA display, which overlays daily average fine particulate matter concentrations (PM2.5) from the U.S. Environmental Protection Agency’s (EPA) AirNow network onto a map of the area.
The PM2.5 concentration measurements from the AirNow network are represented as colored dots. The colors of the dots match the colors of EPA’s Air Quality Index (AQI). Code Orange and Code Red values represent particulate concentrations in excess of the daily NAAQS. The 24-hour average PM2.5 concentrations on 7 May in the northern plains (Figure 4) ranged from Code Red in northwestern Iowa and metropolitan Minneapolis–Saint Paul, Minn., to Code Orange in metropolitan Omaha and Lincoln, Neb., and Bismarck, N.D. This event lasted only 1 day, with PM2.5 concentrations dropping down into the safer Code Yellow range across the northern plains on 8 May.
A New Satellite Means Faster Updates in eIDEA’s Future
Last November, NASA launched NOAA’s Geostationary Operational Environmental Satellite–R Series (GOES-R) geostationary weather satellite, now known as GOES-16. The eIDEA website will be updated to include new aerosol products derived from GOES-16 data as soon as they become available sometime in late summer or early autumn of 2017.
GOES-16 is the first in the next generation of geostationary Earth-observing satellites. It has a sensor similar to VIIRS, called the Advanced Baseline Imager (ABI), that will routinely provide aerosol observations every 15 minutes over the full disk of the Earth, covering North and South America, and every 5 minutes over the CONUS. In this way, the GOES-16 ABI will provide nearly continuous, high-accuracy aerosol observations of the atmosphere over the entire Western Hemisphere, in contrast to the once-daily afternoon snapshots available using VIIRS.
When GOES-16 satellite data are incorporated into eIDEA, forecasters will have nearly continuous observations of smoke plumes in the atmosphere.
The GOES-16 ABI can also scan a small mesoscale subsection of the CONUS every 30 seconds. This mesoscale region will vary depending on current conditions; it will be an area of intense weather or fire activity where conditions are changing rapidly. With aerosol and cloud imagery routinely available at 5-minute intervals, data from GOES-16 will become indispensable for forecasters who need to assess the effects of smoke to help protect public safety and air quality.
When GOES-16 data are incorporated into eIDEA, forecasters will have nearly continuous observations of smoke plumes in the atmosphere. The eIDEA website will include animations of GOES-16 AOT, smoke mask, and true-color imagery. Composites of daily GOES-16 imagery will compensate for AOT data that are missing because of cloud cover. Using these new capabilities, forecasters will be able to provide more detailed information than ever before to the agencies and organizations responsible for protecting lives and property.
Author Information
Amy K. Huff (email: [email protected]), Meteorology Department, Pennsylvania State University, University Park; and Shobha Kondragunta, Center for Satellite Applications and Research, National Environmental Satellite, Data, and Information Service, NOAA, College Park, Md.
Correction, 4 April 2017: The Suomi NPP satellite is a collaboration between NOAA and NASA, and the GOES-16 is a NOAA satellite. The article has been updated to reflect these affiliations.
Citation:
Huff, A. K., S. Kondragunta (2017), Meteorologists track wildfires using satellite smoke images, Eos, 98, https://doi.org/10.1029/2017EO070275. Published on 04 April 2017.
Text © 2017. The authors. CC BY 3.0
Except where otherwise noted, images are subject to copyright. Any reuse without express permission from the copyright owner is prohibited.