
The famous Giant’s Causeway on the coast of Northern Ireland comprises tens of thousands of spectacular basalt columns created as ancient lava flows slowly cooled and fractured into characteristic polygonal forms. Impressive in size though it is, the causeway is only a small part of the Antrim Lava Group, which comprises formations resulting from flood basalt eruptions that covered large areas with lava in the Paleocene, about 60 million years ago [Ganerød et al., 2010].
At that time—just prior to continental separation and the onset of seafloor spreading in the northeastern Atlantic Ocean—these large eruptions were scattered across the entire region, forming the vast North Atlantic Igneous Province (NAIP). Remnants of these flood basalts are found on both sides of the Atlantic, from western Greenland and Baffin Island in the west to the northwestern European margin—including at Giant’s Causeway, Fingal’s Cave in Scotland, and elsewhere around Ireland and Great Britain—in the east [Peace et al., 2020].
In contrast to recent eruptions in the North Atlantic, those occurring 60 million years ago were not focused in the same area but, rather, were scattered across thousands of kilometers.
Today, volcanic activity in the northeastern Atlantic continues through numerous volcanoes in Iceland. This volcanism is unusual in that it occurs on a plate tectonic boundary—that separating the Eurasian and North American plates—but is not caused just by tectonic activity. Instead, the volcanism and the abnormally shallow bathymetry of the northeastern Atlantic basin are thought to be caused by the Iceland plume, an upwelling of hot mantle rock originating from the core-mantle boundary that causes the tectonic plate in this region to flex upward [Morgan, 1971].
The formation of the NAIP has also been attributed to this plume [White and McKenzie, 1989]. In contrast to recent eruptions, however, those occurring 60 million years ago were not focused in the same area but, rather, were scattered across thousands of kilometers. Explaining this broadly distributed volcanism, as well as many other outstanding questions about the dynamics and evolution of the Iceland plume and North Atlantic lithosphere, has long motivated scientific inquiry, but clear answers have been hard to come by because of gaps in seismic data coverage.
Recently, researchers working on a new project, called Structure, Evolution and Seismicity of the Irish Offshore (SEA-SEIS), have collected data that will provide new insights into these old questions and that may finally tell us whether and how the Iceland plume could have caused havoc across the North Atlantic 60 million years ago [White and Lovell, 1997].
Hot Mantle, Heated Debates
Hot plumes of rock that rise slowly from Earth’s core-mantle boundary to the surface are conventionally thought to be the cause of large igneous provinces, such as the NAIP, and of continental rifting and breakup [Morgan, 1971]. The breakup leading to the opening of the North Atlantic Ocean, however, was a complex, multistage process accompanied by compositionally variable and geographically scattered magmatic events—events that are far from fully understood [Peace et al., 2020].
Whereas some researchers have countered the plume model with alternatives that attempt to explain NAIP volcanism solely through lithospheric processes, others debate mechanisms by which magma from a relatively narrow mantle plume can be distributed over a much broader area of the surface. In particular, to what extent might topography at the base of the lithosphere have influenced the NAIP?
Topography at the lithosphere-asthenosphere boundary can include channels that guide lateral flows of buoyant material supplied by mantle plumes for many hundreds of kilometers.
The thickness of Earth’s tectonic plates varies laterally and is typically between 60 and 300 kilometers. Just as the topsides of these plates can have differing topography—shaped by tectonic forces, by volcanism, and by weathering and sedimentation processes at the planet’s surface—the undersides can as well, as a result of interactions between the lithosphere of the plates and the hotter, more ductile asthenosphere. This topography at the lithosphere-asthenosphere boundary (LAB) can include channels that guide lateral flows of buoyant material supplied by mantle plumes for many hundreds of kilometers. Such thin-lithosphere channels have been observed in seismic tomography models at the base of the currently active East Africa–Arabia volcanic region [Celli et al., 2020]. They have also been detected beneath Greenland [Lebedev et al., 2018], offering a potential explanation for Paleocene volcanism that occurred simultaneously along both its western and eastern coasts [Steinberger et al., 2019].
Could the topography of the LAB beneath the stretched continental lithosphere to the west and northwest of present-day Ireland—the westernmost portion of the Eurasian plate—have channeled hot material from the Iceland plume all the way to Ireland and Great Britain? If so, some of that topography might still be present today, as it is beneath Greenland, despite the continuing thermal evolution and reshaping of the LAB. Land-based seismic instruments do not offer the needed resolution to detect and map such features. Rather, we need data from seismic stations deployed on the North Atlantic seafloor—data that were not available until the SEA-SEIS project.
Seismometers Dive Deep
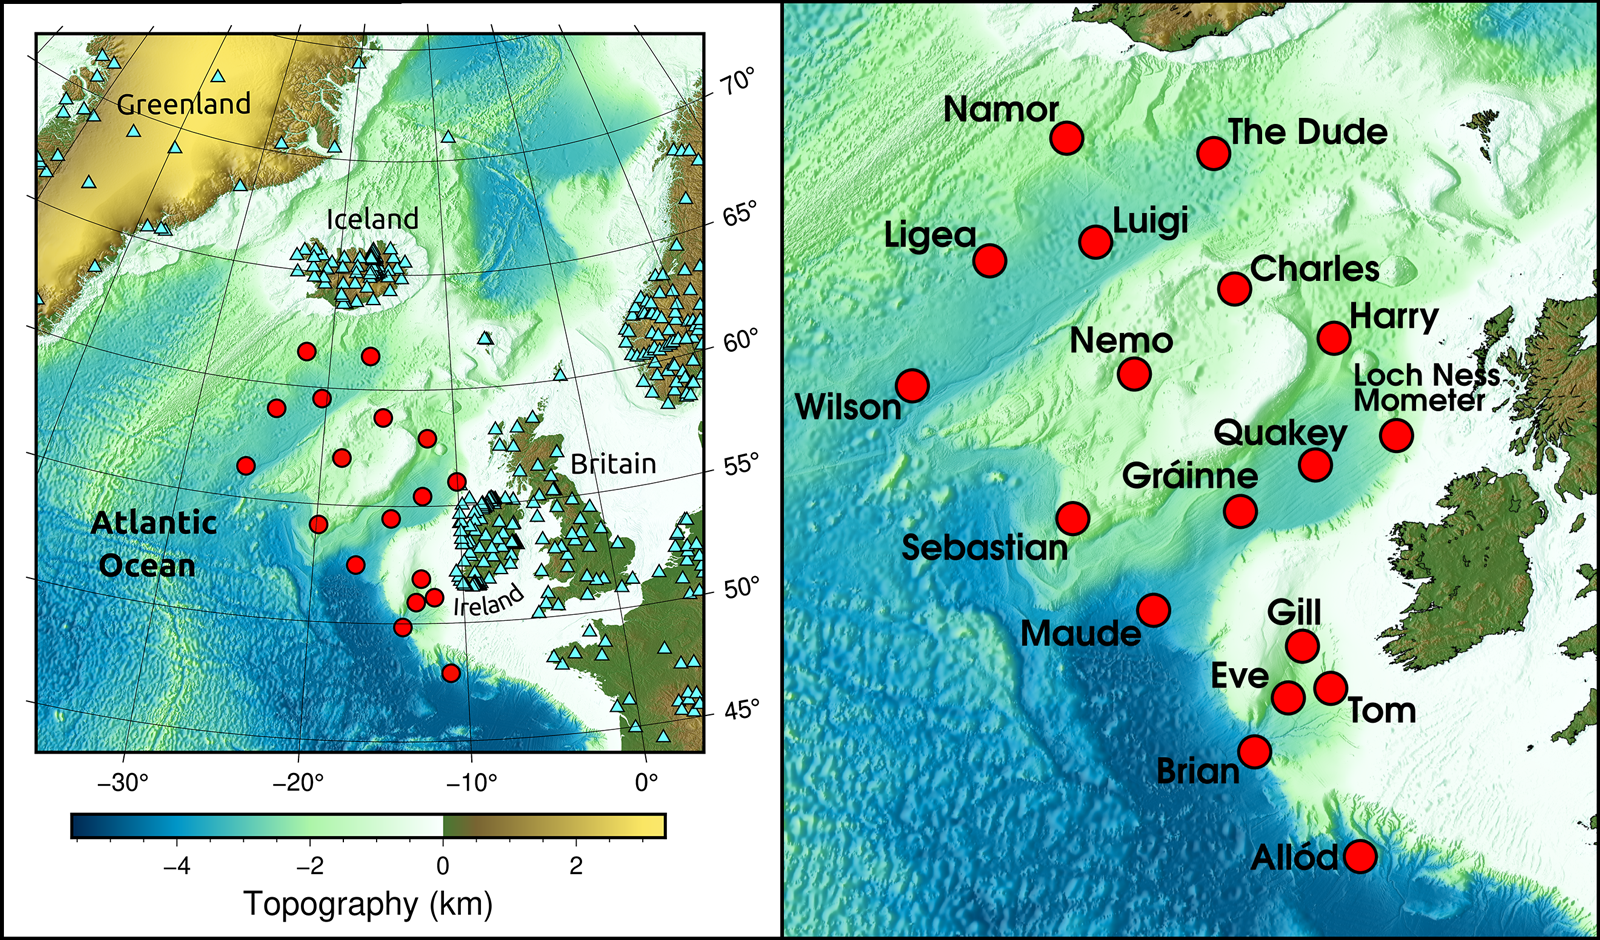
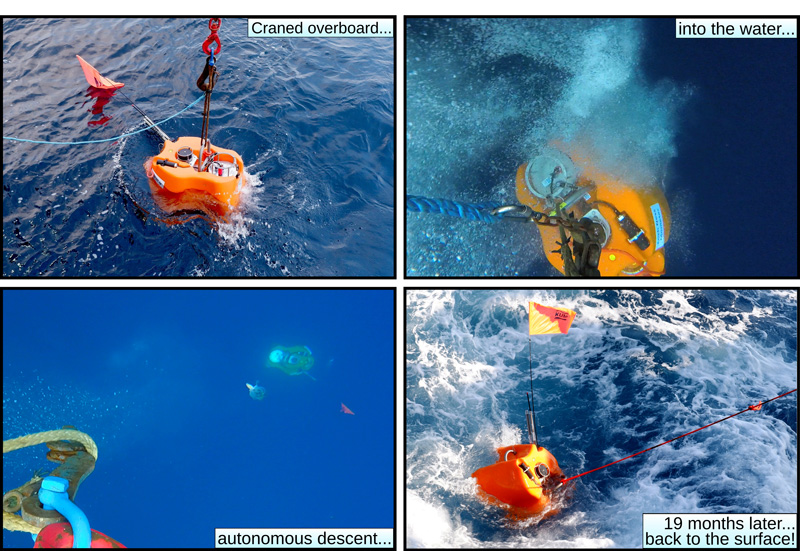
In September and October 2018, seismologists from the Dublin Institute for Advanced Studies (DIAS) in Ireland deployed 18 ocean bottom seismometers (OBSs) from the R/V Celtic Explorer, operated by Ireland’s Marine Institute, to the bottom of the northeastern Atlantic at depths of 1–4 kilometers (Figure 1). The network covered offshore waters south, west, and northwest of Ireland, as well as south of Iceland. The OBS units were NAMMUs, manufactured by Umwelt- und Meerestechnik Kiel (K.U.M.) in Germany, equipped with Trillium Compact 120-second broadband seismometers. They recorded three ground motion components and a broadband hydrophone channel, all at 250 samples per second.
The station retrieval cruise took place from April to May 2020, at the height of the first wave of the COVID-19 pandemic, requiring organization and planning efforts by DIAS and the Marine Institute above and beyond those of typical research cruises. Each of the scientists involved self-isolated for 14 days prior to the survey before a private bus delivered them from their homes in Dublin to the ship in Galway. On board, each person had their own cabin and observed social distancing and other measures, like staggered mealtimes, for the duration of the cruise, which was completed without illness or other incident.
Of the 14 instruments retrieved, one recorded data for 17 months, and the other 13 recorded for the full 19 months of the deployment, thanks to the batteries powering the instruments well past their 14-month nominal life span. Four of the instruments (Allód, Harry, Nemo, and Sebastian; see Figure 1) responded to communications from the ship but failed to detach from their anchors and, at the time of writing, remain on the seafloor. Recovery with a remotely operated underwater vehicle at a later date is now the most realistic—albeit challenging—option.
Earthquakes and Whale Songs
SEA-SEIS has now delivered broadband seismic data from across a vast stretch of the North Atlantic seafloor. The new data will shed light on patterns and locations of offshore seismicity west of Ireland, which remains poorly understood but includes earthquakes larger than those occurring onshore Ireland. From preliminary analyses, the data indeed show clear recordings of both regional and teleseismic (distant) earthquakes; an example of one of these recordings is presented in the video clip below.
These recordings will facilitate tomographic imaging and other seismic studies, which will yield new information about the lithospheric structure and evolution of the North Atlantic region. This information will reveal the structure and thickness of the lithosphere, which has been observed to be generally colder and thicker in the eastern compared with the western half of the northeastern Atlantic basin [Celli et al., 2021]. We will use the new imaging to search for thin-lithosphere channels connecting Iceland with volcanic areas in and around Ireland and Great Britain.
The new data will fill the large existing sampling gap and help us to reconcile puzzling and seemingly contradictory observations.
SEA-SEIS data should also inform understanding of the Iceland plume itself. Many whole-mantle tomography models show a major low-seismic velocity anomaly, interpreted as the Iceland plume, in the shallow lower mantle (below 660-kilometer depth) to the southeast of Iceland [Bijwaard and Spakman, 1999]. Recent waveform tomography, by contrast, showed a tilted low-velocity anomaly rising toward Iceland from the northwest, beneath eastern Greenland [Celli et al., 2021]. The new data will fill the large existing sampling gap and help us to reconcile these and other puzzling and seemingly contradictory observations.
Beyond revealing new information about regional seismic activity, lithospheric structure, and volcanism past and present, SEA-SEIS data will aid other investigations as well. Recordings of the ambient noise between earthquakes, created as the ocean interacts with the seafloor and the continental shelf, will be analyzed to study noise generation and propagation in the North Atlantic [Le Pape et al., 2021]. The SEA-SEIS data set also presents 19 months of continuous recordings of baleen whale vocalizations (a sample of which is given in the video clip below) collected across an area spanning more than half the width of the northeastern Atlantic Ocean.
The frequency band of the seismic and hydrophone data—determined at the high-frequency limit by the 250-per-second sampling rate—is sufficient to capture the ranges of blue and fin whale vocalizations, as well as the low-frequency parts of the ranges of humpbacks and North Atlantic right whales. The SEA-SEIS data set will be used to map the acoustic environment of these great whales, to detect and track them, and to study their migration patterns.
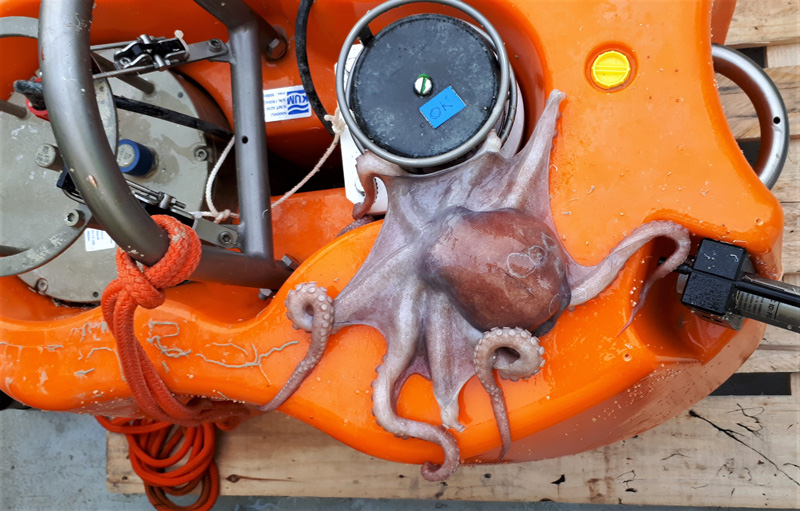
We were reminded often of the close presence of whales and other sea life while at sea. Fin whales that passed by were easily spotted by their tall columnar blows. Large groups of pilot whales surrounded the ship when we stopped and communicated with OBSs via an overboard transducer. They seemed curious about these acoustic communications, which are low amplitude by design, and the transducer picked up their constant squeaky chatter. When we lifted the seismometers onto the deck, we found that the ones from greater depths had been populated by hydroids, mollusks, and sponges. The two seismometers retrieved from depths of less than 1,200 meters each carried three octopuses guarding eggs laid on the devices.
The mix of seismic, biological, and human signals in the SEA-SEIS data is awe-inspiring. When the signals are transformed into frequencies audible by the human ear, they give the listener the powerful experience of perceiving Earth and the ocean directly. Listen, for example, to the sample in the video below produced by the Sounds of the Earth project using recordings collected from the “Brian” OBS.
The Lighter Side of Seismometry
Education and outreach were major components of the SEA-SEIS project, which worked with schools to encourage students’ interest in science and science careers. In one competition in 2018, prior to the deployment cruise, the SEA-SEIS seismic stations were all named by students from Ireland and as far away as Italy, who drew inspiration from various sources for their creativity (Figure 1).
Most of the participating schools also took part in live video linkups with scientists on the research ship during the deployment and retrieval cruises, allowing students to glimpse research in action. And further competitions had primary and secondary school students create Earth science and SEA-SEIS themed drawings and songs, as you can see—and hear!—in the following video:
SEA-SEIS researchers themselves found the engagement with teachers and students exciting and rewarding [Lebedev et al., 2019]. And the outreach gave them opportunities to tap their creative sides by, for example, creating engaging videos (see below) that were used to publicize the project online through blogs and social media. SEA-SEIS was also covered extensively in national and regional news media in Ireland, exposing broader audiences to the work.
A Clearer View Below the Seafloor
Heated debates about the origins of North Atlantic volcanoes continue to stimulate multidisciplinary research and lead to a deeper understanding of mantle dynamics and its relationship to magmatism. Uncertainty has persisted, however, because of a vast gap in data sampling related to the lack of seismometers on the North Atlantic seafloor. The SEA-SEIS seismic stations fill a big part of this gap, allowing us to see deep below the North Atlantic seafloor and address long-standing and fundamental questions.
These data should help reveal the deep structure of the Iceland plume, past and current dynamics of the North Atlantic lithosphere, and interactions between the two—all with greatly improved clarity. As for Giant’s Causeway, we plan to find out whether its distinctive columns really do share the same deep-mantle origins as the volcanoes now active in Iceland.
Acknowledgments
The OBSs and logistical support were provided by the Insitu Marine Laboratory for Geosystems Research (iMARL). We are grateful to Capt. Denis Rowan and the crew of the R/V Celtic Explorer and to R/V manager Aodhán Fitzgerald, Rosemarie Butler, and others at the Marine Institute for their expert assistance in collecting these unique data. The OBSs were NAMMU models, manufactured by K.U.M. in Germany. The data, now undergoing extensive preprocessing, quality control, and preparation for use in research, will be made openly available after the end of the project, scheduled for 2024. SEA-SEIS is cofunded by Science Foundation Ireland, the Geological Survey of Ireland, and the Marine Institute (grant 16/IA/4598). SEA-SEIS would not be possible without the dedication and hard work of everybody on the SEA-SEIS team.
References
Bijwaard, H., and W. Spakman (1999), Tomographic evidence for a narrow whole mantle plume below Iceland, Earth Planet. Sci. Lett., 166, 121–126, https://doi.org/10.1016/S0012-821X(99)00004-7.
Celli, N. L., et al. (2020), African cratonic lithosphere carved by mantle plumes, Nat. Commun., 11, 92, https://doi.org/10.1038/s41467-019-13871-2.
Celli, N. L., et al. (2021), The tilted Iceland plume and its effect on the North Atlantic evolution and magmatism, Earth Planet. Sci. Lett., in press.
Ganerød, M., et al. (2010), The North Atlantic Igneous Province reconstructed and its relation to the Plume Generation Zone: The Antrim Lava Group revisited, Geophys. J. Int., 182(1), 183–202, https://doi.org/10.1111/j.1365-246X.2010.04620.x.
Lebedev, S., et al. (2018), Seismic tomography of the Arctic region: Inferences for the thermal structure and evolution of the lithosphere, in Circum-Arctic Lithosphere Evolution, edited by V. Pease and B. Coakley, Geol. Soc. Spec. Publ., 460, 419–440, https://doi.org/10.1144/SP460.10.
Lebedev, S., et al. (2019), Education and public engagement using an active research project: Lessons and recipes from the SEA-SEIS North Atlantic Expedition’s programme for Irish schools, Geosci. Commun., 2, 143–155, https://doi.org/10.5194/gc-2-143-2019.
Le Pape, F., D. Craig, and C. J. Bean (2021), How deep ocean–land coupling controls the generation of secondary microseism Love waves, Nat. Commun., 12, 2332, https://doi.org/10.1038/s41467-021-22591-5.
Morgan, W. J. (1971), Convection plumes in the lower mantle, Nature, 230, 42–43, https://doi.org/10.1038/230042a0.
Peace, A. L., et al. (2020), A review of Pangaea dispersal and large igneous provinces: In search of a causative mechanism, Earth Sci. Rev., 206, 102902, https://doi.org/10.1016/j.earscirev.2019.102902.
Steinberger, B., et al. (2019), Widespread volcanism in the Greenland–North Atlantic region explained by the Iceland plume, Nat. Geosci., 12, 61–68, https://doi.org/10.1038/s41561-018-0251-0.
White, N., and B. Lovell (1997), Measuring the pulse of a plume with the sedimentary record, Nature, 387, 888–891, https://doi.org/10.1038/43151.
White, R., and D. McKenzie (1989), Magmatism at rift zones: The generation of volcanic continental margins and flood basalts, J. Geophys. Res., 94(B6), 7,685–7,729, https://doi.org/10.1029/JB094iB06p07685.
Author Information
Sergei Lebedev ([email protected]), Raffaele Bonadio, Maria Tsekhmistrenko, Janneke I. de Laat, and Christopher J. Bean, Dublin Institute for Advanced Studies, Ireland
Citation:
Lebedev, S., R. Bonadio, M. Tsekhmistrenko, J. I. de Laat, and C. J. Bean (2021), Seafloor seismometers look for clues to North Atlantic volcanism, Eos, 102, https://doi.org/10.1029/2021EO159380. Published on 08 June 2021.
Text © 2021. The authors. CC BY-NC-ND 3.0
Except where otherwise noted, images are subject to copyright. Any reuse without express permission from the copyright owner is prohibited.