
Scientists have known for a long time that various types of rock conduct current differently and that these differences are even more pronounced as the temperatures and pressures increase farther beneath Earth’s surface. They also know that unusual changes in electrical conductivity can signal activity down below, like migrating magma or a release of trapped fluids.
Thus, electrical measurements can uncover clues about the events that trigger earthquakes and volcanic eruptions here on the surface. They can also give clues to the mantle’s structure and dynamics. However, interpreting these signals is far from straightforward.
Earth scientists increasingly use electrical observations made in the field to image Earth’s crust and mantle, in particular, at subduction zones and mid-ocean ridges. An effective means of interpreting these electrical images and placing them into context with other geological observations is key to translating raw data into usable knowledge. Such knowledge includes assessing potential hazards by investigating, for example, links between fluid release and earthquake generation or the production and transport of magmatic melt from its source region to an eventual eruption.
SIGMELTS is a freely available app that helps to characterize electrically conductive or resistive features detected at depth using electromagnetic observations. The objective of this Web application is to facilitate the elaboration of models of the electrical properties of crust and mantle materials, which, in turn, is used to improve the interpretation of field electromagnetic observations. A new version of SIGMELTS is now available.
From Electrical Currents to Material Properties
Earth scientists can use SIGMELTS to link conductivity properties to known properties of various rocks, minerals, aqueous fluids, and magmatic melts.
The ability of various types of rocks and minerals to conduct electrical currents depends on their chemical and physical properties. Thus, changes in electrical conductivity can be indicators of changes in mineral composition from one region to another or whether material in a given region is solid or fully or partially melted. Earth scientists can use SIGMELTS to process and interpret raw conductivity data from the field by linking conductivity properties to known properties of various rocks, minerals, aqueous fluids, and magmatic melts.
Outputs from SIGMELTS help users to interpret electrically conductive anomalies seen in data collected from magnetotelluric and controlled-source electromagnetic surveys in a variety of tectonic settings, such as mid-ocean ridges and subduction zones. These anomalies are usually consistent with results of petrological studies that predict a release of aqueous fluids or the presence of partial melt.
New Features and Capabilities
SIGMELTS 2.0 features significantly expanded capabilities compared with SIGMELTS 1.0 [Pommier and LeTrong, 2011]. SIGMELTS 1.0 lacked important features, including the capability to plot and export the computed data. In addition to a new, more user-friendly layout and an updated and expanded electrical database, SIGMELTS 2.0 now offers the user the option to visualize computed conductivity values on a graph and to export results (in CSV format) for use outside the app (Figure 1).
We have also added a tutorial tab to provide users with some guidance on how to use SIGMELTS. In addition, each tab on the website contains a clear statement of experimental error, coming from both field and laboratory measurements and calculations. Users are strongly encouraged to refer to the literature sources, listed at the bottom of the tabs and used in the SIGMELTS database.
A new “mantle” tab enables users to compute easily the electrical conductivity of a bulk, multiphase, possibly partially molten mantle rock, whose mineralogy is defined by the user (Figure 1). This option allows users to compute any electrical conductivity calculations for realistic compositions. If they like, users can archive their calculations for other app users to access. This crowdsourcing approach should help to improve the interpretation of electrical anomalies detected in the upper mantle.

It’s Not All About Olivine
Including real-world mineral compositions in the mantle tab is one way that SIGMELTS 2.0 overcomes a significant limitation of previous modeling methods. Conductivity models of the upper mantle often have been based on an olivine-only mineralogy, even though recent studies indicate that olivine might not be the most abundant mineral in some regions of the upper mantle. The olivine-only models assume that the contributions of other minerals (such as pyroxenes and garnet) to the mantle’s electrical response can be ignored, but such simplification may lead to significant uncertainties in mantle temperature estimates derived from conductivity.
In the case of a dry mantle (one with little to no water present), the difference in calculated conductivity between an olivine-only mantle and a three-phase mantle (peridotite, a rock that usually contains mostly olivine, with lesser amounts of pyroxenes and garnet) is small in the upper mantle, but this difference increases with temperature, which increases with depth (Figure 2, green and orange curves). This is because garnet, one of the minerals in peridotite, is a better conductor than olivine.
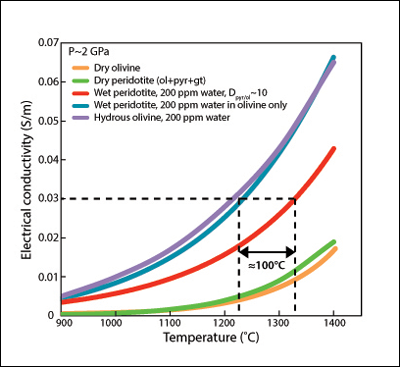
For a wet mantle, strong conductivity differences are observed depending mostly on water distribution. Calculations for a bulk water content of 200 parts per million show that the conductivity of hydrous olivine is similar to that of hydrous peridotite if that water stays primarily in the olivine phase (Figure 2, blue and purple curves).
However, if we account for a more realistic partitioning of water, the bulk electrical conductivity that we calculate decreases by a factor of about 2 over the investigated temperature range (Figure 2, red curve). This leads to a significant change in the estimate of mantle temperature. For instance, the assumption of a bulk conductivity value of 0.03 siemen per meter in a mantle composition consisting of only hydrous olivine or of hydrous peridotite with water contained only in olivine produces an estimated mantle temperature of about 1,220°C–1,230°C (Figure 2, blue and purple curves). Accounting for water partitioning between olivine and pyroxene provides a value of 1,330°C (Figure 2, red curve).
Alternatively, if we assume that we know the mantle temperature, then the conductivity value can be used to estimate the degree of mantle hydration. For example, considering a mantle temperature of 1,300°C, a bulk conductivity value of more than 0.01 siemen per meter would suggest mantle hydration (Figure 2).
These simple calculations highlight the importance of combining geochemical constraints and petrological knowledge with electrical measurements.
Using SIGMELTS 2.0
Users should understand the petrology and tectonics of the area of interest because a conductive anomaly value can rarely be uniquely interpreted in terms of conductivity alone.
Users of SIGMELTS should have an understanding of the petrology and tectonics of the area of interest because a conductive anomaly value can rarely be uniquely interpreted in terms of conductivity alone. For example, the differences in the conductivity of partial melts and fluids are critically dependent on their temperature and composition.
In the Cascadia subduction zone along the western coast of North America, for instance, a conductivity anomaly of ~1 siemen per meter is observed next to the slab at 80-kilometer depth. This anomaly is consistent with the release of aqueous fluids from the slab and the generation of melt [McGary et al., 2014].
However, unraveling the effects of temperature and composition on bulk conductivity of the aqueous fluids and melts requires incorporating information on the fluid phase composition from petrologic studies and the temperature field from numerical models [Pommier and Evans, 2017]. Knowledge of the thermal structure of the considered field area is often critical to the interpretation of electrical anomalies because conductivity is very sensitive to temperature. What’s more, the stability of minerals as well as the onset of melting strongly depends on the thermal state.
An example of a location where research incorporates thermal structure in the interpretation of electrical anomalies is along the East Pacific Rise. There, petrology studies (Figure 3, middle) give an indication of the various materials expected below the mid-ocean ridge. The computed conductivities (Figure 3, right) for these materials are in good agreement with the electrical profile measured in the field (Figure 3, left).
In short, SIGMELTS 2.0 makes it easier to interpret conductivity data and to integrate the results with those from petrology studies and computational modeling. As a result, Earth scientists can construct a more detailed and accurate representation of geological processes far below Earth’s surface.

Acknowledgments
SIGMELTS 2.0 is hosted and maintained at the Institute of Geophysics and Planetary Physics (IGPP), Scripps Institution of Oceanography. Those interested in finding out more about SIGMELTS can contact us at [email protected]. We thank Rob Evans, Mickael Laumonier, and Steve Constable for providing feedback during the elaboration of SIGMELTS 2.0, and we are grateful to Kerry Key and an anonymous reviewer for fruitful comments. This work is supported by the IGPP Green Foundation and the National Science Foundation (EAR-1461594, EAR-1551200).
References
Dasgupta, R., et al. (2013), Carbon-dioxide-rich silicate melt in the Earth’s upper mantle, Nature, 493, 211–215, https://doi.org/10.1038/nature11731.
Hauri, E. H., G. A. Gaetani, and T. H. Green (2006), Partitioning of water during melting of the Earth’s upper mantle at H2O-undersaturated conditions, Earth Planet. Sci. Lett., 248, 715–734, https://doi.org/10.1016/j.epsl.2006.06.014.
Key, K., et al. (2013), Electrical image of passive mantle upwelling beneath the northern East Pacific Rise, Nature, 495, 499–502, https://doi.org/10.1038/nature11932.
McGary, R. S., et al. (2014), From slab to surface: Imaging the complete pathway for melt and fluids beneath Mount Rainier in the Cascadia subduction system, Nature, 511, 338–341, https://doi.org/10.1038/nature13493.
Pommier, A., and R. L. Evans (2017), Constraints on fluids in subduction zones from electromagnetic data, Geosphere, 13, 1,026–1,041, https://doi.org/10.1130/GES01473.1.
Pommier, A., and E. LeTrong (2011), SIGMELTS: A Web portal for electrical conductivity calculations in geosciences, Comput. Geosci., 37, 1,450–1,459, https://doi.org/10.1016/j.cageo.2011.01.002.
Author Information
Anne Pommier (email: [email protected]) and Jeff Roberts, Institute of Geophysics and Planetary Physics, Scripps Institution of Oceanography, University of California, San Diego, La Jolla
Citation:
Pommier, A.,Roberts, J. (2018), Understanding electrical signals from below Earth’s surface, Eos, 99, https://doi.org/10.1029/2018EO108517. Published on 19 November 2018.
Text © 2018. The authors. CC BY 3.0
Except where otherwise noted, images are subject to copyright. Any reuse without express permission from the copyright owner is prohibited.