The Earth sciences are moving to the cloud—and, no, that is not a reference to the weather last week in San Francisco, Calif., at the American Geophysical Union’s Fall Meeting.
With both poster and oral sessions dedicated to cloud computing, the tech speak nod to Internet-based storage and analytics, the annual conference highlighted an array of new developments in Earth observation.
Daniela Moody, a remote sensing and machine learning specialist at Descartes Labs in Los Alamos, N.M., presented one of these advances during a session on Tuesday.
Billed as a “living atlas,” Moody described a real-time, multimodal Web-based interface known as the Descartes Labs Forecasting Platform. The commercial atlas, designed to provide real-time forecasts of commodity agriculture, uses decades of remotely sensed images stored on the cloud to offer land use and land change analysis.
“The platform is built for analysis,” Moody said. “It is not built to store the data.” This is a vastly different philosophy than traditional data platforms, she explained.

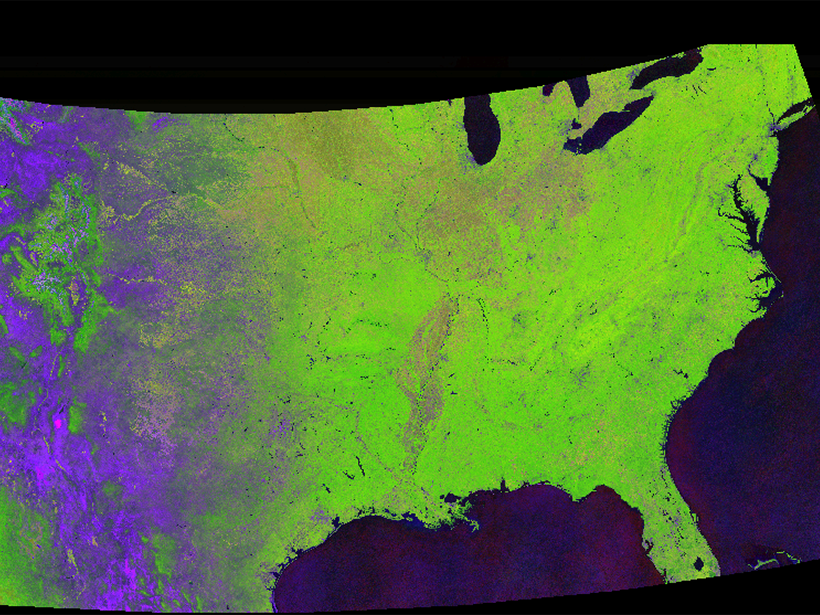
Moody demonstrated the platform’s superpowers for Eos following her presentation. With just a few keystrokes, she accessed the most recent Moderate Resolution Imaging Spectroradiometer (MODIS) images for the continental United States.
In a matter of seconds, the platform seamlessly merged 111 satellite images spanning the lower 48 states. By contrast, stitching together such satellite images manually could take days to weeks.
Impressed? Just wait—creating maps at lightning speed is not the only thing this new platform can do.
A Changing World, at Your Fingertips
In addition to the real-time coverage it provides, the Descartes Labs platform can also slice through time.
The lab previously reprocessed the entire 40-year archive of NASA/U.S. Geological Survey (USGS) Landsat and MODIS imagery (approximately 1000 terabytes) in 16 hours, and with the world at her fingertips, Moody can create “movies” that show how landscapes have evolved.
One of these movies, shown in the video below, demonstrates the platform’s power. To make the video, Moody stitched together cloudless images created using the the normalized difference vegetation index (NDVI) and then sequenced them through time. The result is a time-lapse movie of U.S. land cover change over nearly 15 years. Note the pulsing green—active vegetation—as seasons change.
Processed overnight, the platform accomplished in hours what may have previously taken weeks.
A Layered View of Earth
The platform allows the user to examine images not only at specific locations and times but also at different wavelengths of light.
The platform allows the user to examine images not only at specific locations and times but also at different wavelengths of light. This offers unique insights into land cover changes over broad swaths of land.
For example, the NDVI reveals live green vegetation using a combination of red and near-infrared spectral bands. Combining indices like the NDVI with visible spectral bands allows Moody to evaluate a landscape through many lenses, like a doctor looking at a broken bone using her eyes, an X-ray, and an MRI.
Even better, it can all be done nearly instantaneously. Because the platform is based in the cloud, it has instant access to vast amounts of computing power. The platform’s file system is called Festivus—“A file system for the rest of us,” Moody joked during the presentation, referencing the famous Seinfeld holiday. Festivus can transfer hundreds of terabytes of imagery with a single click.
The power of the cloud frees researchers from tedious preprocessing tasks, like reprojecting and merging data. Instead, they can devote their time to scrutinizing the data.
A Living Atlas
The atlas exists as both a Web interface and an application program interface (API). The Web interface offers options for visualizing data, whereas the API allows the user to interact directly with the data for specific analysis. The platform’s scalable cloud infrastructure quickly ingests, analyzes, and creates predictions from the imagery.
Sourcing its imagery via cloud storage, Descartes Labs pulls images from Google and Amazon Web Services public data sets, as well as from private providers such as Planet. The platform trawls public databases like the MODIS and Landsat programs and also visits the European Space Agency’s Sentinel missions and other satellite imagery providers.
Automated scripts continuously grab new images as soon as they are made available by active satellite sensors, which provides the lab with up-to-date imagery. The “living” aspect of the platform refers to this continuously updating view of the world. The images become part of an ever expanding collection that dates to 1972, when Landsat was initially launched. In total, the database includes approximately a petabyte—that’s 1015 bytes—of data, Moody said.
Tracking a Changing World
The platform’s analytical and search capabilities differentiate it from other cloud-based mapping platforms, like Google Earth Engine or ESRI cloud mapping, which mainly serve as storage facilities and do not offer the analytical capabilities of the Descartes Labs platform.
“We created a platform that…allows us to have a living atlas of the world.”
Jeff de la Beaujardiere, a data management architect with the National Oceanic and Atmospheric Administration, convened Moody’s session. Without using the platform, he found it difficult to assess its quality but added that it looked like a promising technology.
The Earth is not a static place, and researchers who study it need tools that keep up with the constant change. “We designed this platform to answer the problems of commodity agriculture,” Moody said, “and in doing so we created a platform that is incredible and allows us to have a living atlas of the world.”
—Aaron Sidder (email: [email protected]; @sidquan), Freelance Science Writer
Citation:
Sidder, A. (2016), Tracking global change with a cloud-based living atlas, Eos, 97, https://doi.org/10.1029/2016EO065229. Published on 19 December 2016.
Text © 2016. The authors. CC BY-NC-ND 3.0
Except where otherwise noted, images are subject to copyright. Any reuse without express permission from the copyright owner is prohibited.