
Climate change projections include an Achilles heel: We don’t know enough about feedbacks from the terrestrial biosphere. Plants and other organisms take in carbon dioxide (CO2), which they use to manufacture their own food, using photosynthesis. This process lets ecosystems sequester atmospheric CO2, creating one of the largest known feedbacks in the climate system. But models of the global climate system differ greatly in their estimates of carbon uptake, leading to critical uncertainties in global climate projections.
This predicament has inspired a search for new approaches to study the photosynthetic uptake of CO2. In response, atmospheric scientists, biogeochemists, and oceanographers have proposed measuring a gas called carbonyl sulfide (COS or OCS) to help quantify the contribution that photosynthesis makes to carbon uptake. COS is similar in structure and composition to CO2, with a sulfur atom replacing one of CO2’s oxygen atoms.
Ten years ago, scientists discovered a massive and persistent biosphere signal in atmospheric carbonyl sulfide measurements.
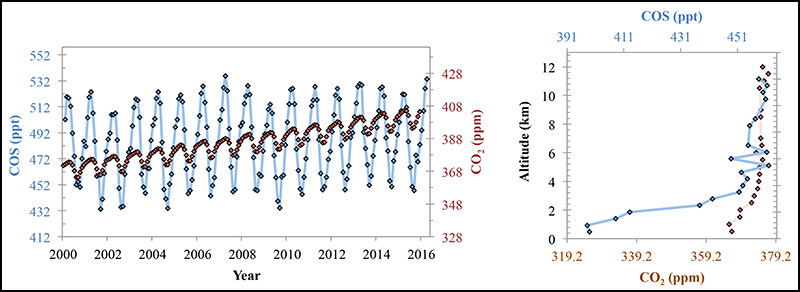
Ten years ago, scientists discovered a massive and persistent biosphere signal in atmospheric COS measurements. In these data, COS and CO2 levels follow a similar seasonal pattern, but the COS signal is much stronger over continental regions, suggesting that the terrestrial biosphere is a sink for COS [Campbell et al., 2008; Montzka et al., 2007]. The remarkable discovery led scientists to wonder: Could COS be used as a tracer for carbon uptake?
An explosive growth in COS studies followed as scientists attempted to answer this question, including a COS record from the present to the Last Glacial Maximum, satellite-based maps of the dynamics of COS in the global atmosphere, and measurements of ecosystem fluxes of COS.
The accumulated research has led to heightened expectations of COS as a viable tracer of carbon uptake but also has pointed to new complexities. Now the scientific community is at a crossroads. Will analysis of COS prove to be a dead end, or will these new data provide a road map to a critical line of evidence for global change research? A wide range of studies now underway may provide the answers.
Regional Photosynthesis and Climate Projections
Photosynthesis is a key climate forcing process in the terrestrial biosphere. It removes CO2 from the atmosphere and stores carbon in plants, slowing the rate of climate change. This photosynthetic CO2 uptake is known as gross primary production (GPP).
At the same time, higher global CO2 concentrations, caused by human activities, may stimulate GPP and carbon sequestration by ecosystems, creating a negative feedback in the climate system. Climate projections must take this “CO2 fertilization effect” into account. So GPP process models that simulate this effect are embedded in global climate models.
However, the quantitative representation of the CO2 fertilization effect has a high uncertainty and varies dramatically in different global models. This uncertainty contributes to the size of the range of changes seen in climate projections using various models from the Coupled Model Intercomparison Project (CMIP) [Friedlingstein et al., 2006; Mahmood et al., 2016; Marland et al., 2003].
The root of this problem is scale. Extensive experiments have provided reasonable estimates of GPP at leaf level and site scale (on the order of 1 square kilometer). However, we lack robust measurement-based approaches for estimating GPP at regional to global scales.
Hence, the GPP process models embedded in global climate models rely on spatially extrapolated data for calibration. Large uncertainties in extrapolation propagate to critical uncertainties in the CMIP global climate projections.
The Carbonyl Sulfide Signal
Variations in atmospheric COS could help to track GPP and help quantify CO2 sources and sinks. COS and CO2 vary in a similar way with the seasons, but the strength of the signal is 6 times larger for COS than for CO2. This makes satellite and atmospheric surveys more readily able to detect variations in COS than CO2, while at the same time measurements are scalable to CO2 and thus GPP in the terrestrial system.
The regional COS signal is consistent with plant growth chamber measurements that show a close relationship between COS plant uptake and GPP [Sandoval-Soto et al., 2005; Stimler et al., 2010]. The plant uptake of COS is controlled largely by its passage through leaf pores (stomatal conductance), which is also a strong control on GPP. In turn, the signal is also consistent with canopy-scale measurements [Asaf et al., 2013] and global process–based models [Berry et al., 2013].
A Photosynthesis Tracer
Several unique aspects of global atmospheric COS budgets encourage the proposed use of COS as a GPP tracer. First, COS sources and sinks are generally separated in space. The dominant global source is the oceans, and the dominant global sink is linked to GPP over the continents.
However, researchers have observed additional continental sources and sinks, which suggests that COS observations do not provide a direct measurement of GPP. Nonetheless, at a regional scale, COS plant uptake is larger than these other continental sources and sinks.
Second, model analyses of atmospheric observations suggest that the terrestrial plant sink drives the seasonal cycle of atmospheric COS concentrations in the Northern Hemisphere. This observation is supported by the relatively small seasonal variations in COS from the ocean source compared with the relatively large seasonality of the plant COS sink [Launois et al., 2015a, 2015b].
Finally, nearly the entire global reservoir of COS is in the atmosphere. COS stays in the atmosphere for 1–3 years, a “sweet spot” for inferring global GPP from COS concentrations measured in air samples taken from ice cores and firn (uncompressed glacial snow) [Campbell et al., 2017]. The lifetime is long enough for COS to be globally well mixed but not so long as to obscure the dynamics of sources and sinks over the industrial era.
Measurement Capacity
In recent years, the capacity for COS measurements has expanded greatly. Ice core analysis took the COS record through a glacial cycle [Aydin et al., 2016], multiple satellites yielded the first global COS maps, and new spectroscopy techniques enabled flux tower measurements.
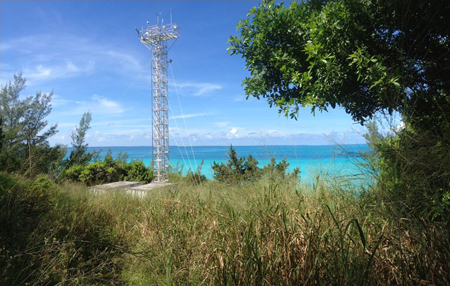
In addition to these advances, the National Oceanic and Atmospheric Administration (NOAA) has continued to make COS measurements through its global air monitoring network. The network has created an ongoing 16-year COS record at 12 global background sites and additional less remote surface sites and has complemented these with measurements from aircraft.
New Complications, Heightened Expectations
Although several recent discoveries have introduced new complications in COS budgets, others have enhanced the promise of COS as a GPP tracer.
Global anthropogenic sources of COS are a potentially complicating factor for using COS to assess global GPP. However, these sources are increasing over China and declining over the rest of the globe, which supports many regional applications of the COS tracer [Campbell et al., 2015].
Laboratory and field studies have revealed diurnal variations in the ratio of plant uptake of COS relative to plant uptake of CO2 [e.g., Stimler et al., 2010; Wehr et al., 2017], which complicates the use of COS for canopy-scale estimation of GPP. However, regional-scale trends in COS measurements are remarkably insensitive to these short-term dynamics, and the analysis of these trends is primarily related to regional GPP [Hilton et al., 2017]. Furthermore, the daily-integrated relationship between plant uptake of COS and CO2 is remarkably consistent across independent measurement techniques [Berkelhammer et al., 2014; Kesselmeier and Merk, 1993; Maseyk et al., 2014; Sandoval-Soto et al., 2005; Wohlfahrt et al., 2012].
Although several recent discoveries have introduced new complications in COS budgets, others have enhanced the promise of COS as a gross primary production tracer.
Additional complicating factors include ecosystem sources of COS to the atmosphere and nighttime plant uptake [Bloem et al., 2012; Commane et al., 2015; Maseyk et al., 2014]. Although these newly discovered ecosystem processes have not been shown to be significant at regional scales, they should be quantified, understood, and included in models that use COS observations to infer regional GPP [Sun et al., 2015; Whelan et al., 2016].
COS Budget Gaps
Addressing gaps in the COS budget will require additional experiments. For example, few COS studies have explored tropical ecosystems, but multiple Amazon studies now under way will produce regional airborne and tall-tower measurements as well as detailed ecosystem measurements. These studies are needed to address the dominant role of tropical ecosystems in the biogeochemical cycles of both COS and CO2.
Recent comparisons of global top-down and bottom-up studies have revealed a missing source in the global COS budget. New analysis suggests that the missing source may be associated with ocean emissions in the Pacific warm pool region or industrial activity in China. Progress in these two regions is critical for closing gaps in the global budget and improving conclusions related to GPP on large scales.
The Outlook
Increased awareness of the potential of COS as a tracer, as well as improved measurement technology, has motivated a wave of new COS studies that will greatly improve our understanding of the role of COS during photosynthesis.
Given the complexity of the carbon cycle and its importance for understanding climate change, it is imperative to use a diversity of approaches.
At the same time, we know of no one technique that can provide complete information about GPP. Given the complexity of the carbon cycle and its importance for understanding climate change, it is imperative to use a diversity of approaches. Pursuing multiple lines of evidence, including the COS technique, may yet provide a tractable path for addressing the pressing concern of carbon processes within the climate system.
Acknowledgments
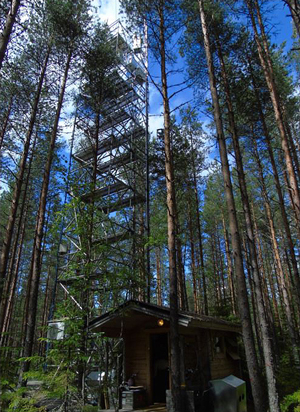
This perspective is based in part on discussions at an international workshop at the Hyytiälä Forestry Field Station in Finland, with support from the European Geosciences Union and Aerodyne Research, Inc. Additional support from the U.S. Department of Energy Terrestrial Ecosystem Science program (DE-SC0011999) is acknowledged.
References
Asaf, D., et al. (2013), Ecosystem photosynthesis inferred from measurements of carbonyl sulphide flux, Nat. Geosci., 6(3), 186–190, https://doi.org/10.1038/ngeo1730.
Aydin, M., et al. (2016), Changes in atmospheric carbonyl sulfide over the last 54,000 years inferred from measurements in Antarctic ice cores, J. Geophys. Res. Atmos., 121(4), 1943–1954, https://doi.org/10.1002/2015JD024235.
Berkelhammer, M., et al. (2014), Constraining surface carbon fluxes using in situ measurements of carbonyl sulfide and carbon dioxide, Global Biogeochem. Cycles, 28(2), 161–179, https://doi.org/10.1002/2013GB004644.
Berry, J., et al. (2013), A coupled model of the global cycles of carbonyl sulfide and CO2: A possible new window on the carbon cycle, J. Geophys. Res. Biogeosci., 118(2), 842–852, https://doi.org/10.1002/jgrg.20068.
Bloem, E., et al. (2012), Sulfur fertilization and fungal infections affect the exchange of H2S and COS from agricultural crops, J. Agric. Food Chem., 60(31), 7588–7596, https://doi.org/10.1021/jf301912h.
Campbell, J. E., et al. (2008), Photosynthetic control of atmospheric carbonyl sulfide during the growing season, Science, 322(5904), 1085–1088, https://doi.org/10.1126/science.1164015.
Campbell, J. E., et al. (2015), Atmospheric carbonyl sulfide sources from anthropogenic activity: Implications for carbon cycle constraints, Geophys. Res. Lett., 42(8), 3004–3010, https://doi.org/10.1002/2015GL063445.
Campbell, J. E., et al. (2017), Large historical growth in global terrestrial gross primary production, Nature, 544(7648), 84–87, https://doi.org/10.1038/nature22030.
Commane, R., et al. (2015), Seasonal fluxes of carbonyl sulfide in a midlatitude forest, Proc. Natl. Acad. Sci. U. S. A., 112(46), 14,162–14,167, https://doi.org/10.1073/pnas.1504131112.
Dlugokencky, E. J., et al. (2001), Measurements of an anomalous global methane increase during 1998, Geophys. Res. Lett., 28(3), 499-502, https://doi.org/10.1029/2000GL012119.
Friedlingstein, P., et al. (2006), Climate–carbon cycle feedback analysis: Results from the C4MIP model intercomparison, J. Clim., 19(14), 3337–3353, https://doi.org/10.1175/JCLI3800.1.
Hilton, T. W., et al. (2017), Peak growing season gross uptake of carbon in North America is largest in the Midwest USA, Nat. Clim. Change, 7, 450–454, https://doi.org/10.1038/nclimate3272.
Kesselmeier, J., and L. Merk (1993), Exchange of carbonyl sulfide (COS) between agricultural plants and the atmosphere: Studies on the deposition of COS to peas, corn and rapeseed, Biogeochemistry, 23(1), 47–59, https://doi.org/10.1007/BF00002922.
Launois, T., et al. (2015a), A new model of the global biogeochemical cycle of carbonyl sulfide: Part 2. Use of carbonyl sulfide to constrain gross primary productivity in current vegetation models, Atmos. Chem. Phys, 15(16), 9285–9312, https://doi.org/10.5194/acp-15-9285-2015.
Launois, T., et al. (2015b), A new model for the global biogeochemical cycle of carbonyl sulfide: Part 1. Assessment of direct marine emissions with an oceanic general circulation and biogeochemistry model, Atmos. Chem. Phys., 15(5), 2295–2312, https://doi.org/10.5194/acp-15-2295-2015.
Mahmood, R., R. A. Pielke Sr., and C. A. McAlpine (2016), Climate-relevant land use and land cover change policies, Bull. Am. Meteorol. Soc., 97(2), 195–202, https://doi.org/10.1175/BAMS-D-14-00221.1.
Marland, G., et al. (2003), The climatic impacts of land surface change and carbon management, and the implications for climate-change mitigation policy, Clim. Policy, 3(2), 149–157, https://doi.org/10.3763/cpol.2003.0318.
Maseyk, K., et al. (2014), Sources and sinks of carbonyl sulfide in an agricultural field in the Southern Great Plains, Proc. Natl. Acad. Sci. U. S. A., 111(25), 9064–9069, https://doi.org/10.1073/pnas.1319132111.
Montzka, S. A., et al. (2007), On the global distribution, seasonality, and budget of atmospheric carbonyl sulfide (COS) and some similarities to CO2, J. Geophys. Res., 112, D09302, https://doi.org/10.1029/2006JD007665.
Sandoval-Soto, L., et al. (2005), Global uptake of carbonyl sulfide (COS) by terrestrial vegetation: Estimates corrected by deposition velocities normalized to the uptake of carbon dioxide (CO2), Biogeosciences, 2(2), 125–132, https://doi.org/10.5194/bg-2-125-2005.
Stimler, K., et al. (2010), Relationships between carbonyl sulfide (COS) and CO2 during leaf gas exchange, New Phytol., 186(4), 869–878, https://doi.org/10.1111/j.1469-8137.2010.03218.x.
Sun, W., et al. (2015), A soil diffusion–reaction model for surface COS flux: COSSM v1, Geosci. Model Dev., 8(10), 3055–3070, https://doi.org/10.5194/gmd-8-3055-2015.
Wehr, R., et al. (2017), Dynamics of canopy stomatal conductance, transpiration, and evaporation in a temperate deciduous forest, validated by carbonyl sulfide uptake, Biogeosciences, 14, 389–401, https://doi.org/10.5194/bg-2016-365.
Whelan, M. E., et al. (2016), Carbonyl sulfide exchange in soils for better estimates of ecosystem carbon uptake, Atmos. Chem. Phys., 16(6), 3711–3726, https://doi.org/10.5194/acp-16-3711-2016.
Wohlfahrt, G., et al. (2012), Carbonyl sulfide (COS) as a tracer for canopy photosynthesis, transpiration and stomatal conductance: Potential and limitations, Plant Cell Environ., 35(4), 657–667, https://doi.org/10.1111/j.1365-3040.2011.02451.x.
Author Information
Elliott Campbell (email: [email protected]), Department of Environmental Studies, University of California, Santa Cruz; Jürgen Kesselmeier, Max Planck Institute for Chemistry, Mainz, Germany; Dan Yakir, Weizmann Institute of Science, Rehovot, Israel; Joe A. Berry, Carnegie Institute for Science, Stanford, Calif.; Philippe Peylin and Sauveur Belviso, Laboratoire des Sciences du Climat et de l’Environnement, Gif-sur-Yvette, France; Timo Vesala, University of Helsinki, Helsinki, Finland; Kadmiel Maseyk, Open University, Milton Keynes, UK; Ulrike Seibt, University of California, Los Angeles; Huilin Chen, University of Groningen, Groningen, Netherlands; Mary E. Whelan, University of California, Merced; also at Carnegie Institute for Science, Merced, Calif.; Timothy W. Hilton, University of California, Merced; Stephen A. Montzka, NOAA, Boulder, Colo.; Max B. Berkelhammer, University of Illinois at Chicago; Sinikka T. Lennartz, Helmholtz Centre for Ocean Research Kiel, Germany; Le Kuai, University of California, Los Angeles; Georg Wohlfahrt, University of Innsbruck, Austria; Yuting Wang, University of Bremen, Germany; Nicola J. Blake and Donald R. Blake, University of California, Irvine; James Stinecipher, University of California, Merced; Ian Baker, Colorado State University, Fort Collins; and Stephen Sitch, University of Exeter, UK
Citation:
Campbell, J. E.,Kesselmeier, J.,Yakir, D.,Berry, J. A.,Peylin, P.,Belviso, S.,Vesala, T.,Maseyk, K.,Seibt, U.,Chen, H.,Whelan, M. E.,Hilton, T. W.,Montzka, S. A.,Berkelhammer, M. B.,Lennartz, S. T.,Kuai, L.,Wohlfahrt, G.,Wang, Y.,Blake, N. J.,Blake, D. R.,Stinecipher, J.,Baker, I., and Sitch, S. (2017), Assessing a new clue to how much carbon plants take up, Eos, 98, https://doi.org/10.1029/2017EO075313. Published on 05 July 2017.
Text © 2017. The authors. CC BY-NC-ND 3.0
Except where otherwise noted, images are subject to copyright. Any reuse without express permission from the copyright owner is prohibited.