
Ashley Ravenscraft had a decision to make. Over the past several hours as a storm rolled through northern Alabama on 11 January, her team at the National Weather Service (NWS) office in Huntsville had already issued two tornado warnings.
Ravenscraft, a meteorologist, had issued the warnings using the Three Ingredients Method, which uses radar inputs to estimate the likelihood a linear storm will shift into a vortex. Then the azimuth motor went down on the closest radar to the storm—a technician had been sent to repair it, but it would be a least an hour before he arrived and would be able to get it back online. The remaining radar stations were far enough from the storm that they were capturing only data above several thousand meters in altitude—too high to make accurate judgments on storm rotation close to the ground.
But Ravenscraft was getting consistent data about one piece of the storm that would become key: lightning.
The NWS had brought a new application online in 2018—Ravenscraft was using it for only the second time. Her color-coded screen was showing 1-minute flash extent density data, or the rate at which lightning was flashing in the area. It was pulling in real-time data from the Geostationary Lightning Mapper (GLM), a near-infrared instrument aboard the GOES-R satellite. As the frequency of flashes increases, the colors on the map move from cool to warm.
“If we start to see these lightning jumps, and we see these updrafts grow, especially combined with the surge in the line we can see on radar, then there’s a good chance we’re going to end up with a tornado.”
A month earlier, on 16 December 2019, Ravenscraft had been on radar for her first big storm and had GLM data up on her screen. As the storm line approached the Huntsville region through northern Mississippi, “I was watching the nature of the lightning jumps [the flash extent density data]—how high it got, how quick it got,” she said. “I knew that they were putting out tornado warnings, and I knew how the radar looked, so I thought, ‘If we start to see these lightning jumps, and we see these updrafts grow, especially combined with the surge in the line we can see on radar, then there’s a good chance we’re going to end up with a tornado.’”
When the storm reached her coverage area, eight reported tornados touched down. Ravenscraft had successfully predicted and sent out a warning for each one.
But there was one additional warning she issued that night, for residents in Lincoln County, Tenn. The lightning jump had been lower than the others she had seen, but combined with what she saw on radar, she made the call. That night, no tornado was reported in that location. A few weeks later, however, her team was looking over the data and became so convinced that something had to have happened there that a colleague drove out to inspect the scene for himself. Ravenscraft had been right: A line of uprooted trees and an eyewitness account from a neighbor confirmed a small twister had touched down. “From that event, we realized how significant the GLM data was.”

Now Ravenscraft was studying the January storm on her monitors, with very limited radar data, and the current tornado warning was just about to expire, which meant residents would believe it was safe to leave shelter. “I started to notice that every minute, the [lightning flash] rate was going up.…I said, this is not good, obviously the updraft was strengthening.” Then the GLM data spiked.
Ravenscraft issued the alert. The action began a cascade of notifications in the area: Weather radios blared the alarm, local media was instantly notified, automated scripts went out on all the regional NWS social media pages, and within about 10 seconds, anyone with a mobile app that pulled NWS data and was within cell range was alerted to take—or, in this case, stay in—shelter.
Almost immediately, an EF2 tornado touched down and slammed into an elementary school, causing significant damage—thankfully, it was a Saturday. “GLM was the decision maker,” Ravenscraft said. “If we had only had radar, we may not have decided to issue that warning.”
Reaching the Perfect Storm of Lightning Detection
GLM is the most recent lightning detection instrument to go online in what is still a relatively young field. In the early 1980s, detection sensors were popping up in regions around the United States. In 1989, they were consolidated into the National Lightning Detection Network (NLDN). Today, a little more than 100 low-frequency sensors are distributed across the continental United States under the operation of Vaisala, a company that performs industrial and environmental observations and makes them available to clients like the NWS.
About 15 years ago, Ryan Said was in the electrical engineering doctoral program at Stanford University. His research group was taking very powerful sensors that had been used for studying the ionosphere and repurposing them into exceptionally sensitive lightning detectors. Where the NLDN sensors can detect lightning around 800 kilometers away, these sensors can pick up lightning emissions up to 10,000 kilometers away. About halfway through development, Vaisala got wind of the project and invested in it—one of the head engineers at the company became Said’s dissertation adviser. That network, called the Global Lightning Dataset 360, or GLD360, launched in 2009. Said wrote the sensor software and location algorithms for it and has been at Vaisala as a senior scientist and systems engineer since 2012.
Between NLDN and GLD360, explained Said, “we can detect these radio signatures from lightning happening anywhere on Earth.” (And he really does mean anywhere. Last June, GLD360 detected the closest flashes to the North Pole ever observed.) When a sensor detects a radio impulse from a flash, the GPS-synchronized data are sent to a central hub and processed into lightning location data. Clients who subscribe to the data get a near-real-time feed that includes the time of each detected stroke within a flash to within a microsecond, the location to within 200 meters in the United States (2 to 3 kilometers for the GLD360), the peak current, and the polarity of a lightning flash.
NLDN tells you, among other things, precisely where powerful strokes may be causing damage, and GLM tells you how far away that storm is still churning.
Many of the people who use this information, like Ravenscraft and her colleagues at NWS Huntsville, use streams from several environmental monitoring networks simultaneously. “They take that real-time feed and then overlay it on their AWIPS [Advanced Weather Interactive Processing System] software,” explained Said, “which is sort of a Swiss Army knife tool that can overlay satellite and radar and lightning data for meteorological information on the same display.”
The major benefit of the NLDN—which detects radio emissions in the very low frequency and low-frequency ranges—is in its precise location pinpointing. GLM observations, meanwhile, capture the flashes from above, making one of its major benefits the ability to see the horizontal extent of a storm and to detect the majority intracloud flashes—flashes that don’t make ground contact but tend to indicate stronger updrafts as they occur in greater numbers (NLDN sensors can detect only about half of all intracloud flashes). In other words, NLDN tells you, among other things, precisely where powerful strokes may be causing damage, and GLM tells you how far away that storm is still churning.
One of the experiments Said and his team are pursuing is using these complementary data sets to study lightning-triggered wildfires. The numbers here themselves are wild: Lightning causes around 16% of wildfires, but those fires cause 56% of the acreage burned, making it a priority for many in the forest services to track these triggering events [Balch et al., 2017].
It’s not as simple as monitoring lightning data during storms. Wildfires are often caused by continuing currents—that’s when a lightning flash establishes a conductive channel to the ground, but instead of concluding in a fast-return stroke, a weaker sustained electrical current continues on the ground for 10 to 100 times longer than the stroke. “An analogy I often give is a hot poker: If you just touch something quickly it might not do much damage, but if you hold it for awhile it can heat up.” If you heat up a patch of underbrush long enough, it catches fire.
The GLM can see this type of sustained flash—from 10 to several hundred milliseconds long—but can resolve its location only to around 64 square kilometers. Vaisala is testing software that takes these broad GLM data points and combines them with NLDN data to narrow down the location to 200 meters. That’s information that emergency management personnel could use to go investigate potentially smoldering locations before they catch.
What Lightning Tells You at a Glance
Going one step further, one group is trying to take these data and create automated wildfire detection algorithms. Chris Schultz is a research meteorologist at NASA’s Short-term Prediction Research and Transition Center, or SPoRT, in Huntsville. He recently led a team that looked at how long an area might smolder before catching fire after it has been struck by lightning. In a paper published last year, they found that half of causal flashes occurred the same day as the fire, but the rest were tracked largely between 2 and 5 days before the fire was spotted—one fire in New Mexico didn’t catch until 12 days after the causal lightning strike [Schultz et al., 2019].
A new lightning detection application could be used by public safety leaders such as football game managers and lifeguards to easily and accurately know when people can safely come back outside.
“The end goal is to develop an algorithm where you have all the inputs of precipitation, storm type, and land surface and soil moisture that forecasters look for as assessment of the fire danger,” said Schultz, “and then as thunderstorms roll through you can evaluate the likelihood of a fire” from a lightning strike, even if it doesn’t ignite for a week.
SPoRT is tasked with developing all sorts of tools that can help forecasters and anyone charged with public safety to handle the ever-changing weather. Later this year, the National Oceanic and Atmospheric Administration will be rolling out the Time Since Last Flash tool, an operational version of a concept that SPoRT created that uses GLM data. The tool automatically changes colors on a digital map from red to yellow to, finally, green, when lightning was last detected 30 minutes ago. It’s a simple application that could be used by football game managers or lifeguards to easily and accurately know when people can safely come back outside.
Other applications are those that meteorologists like Ravenscraft use, such as the colors that indicate a spike in lightning rates. “The hardest thing to measure in atmospheric sciences is vertical motion,” said Schultz, so forecasters use lightning as a proxy for that motion.
“We’ve got to this point where forecasters are comfortable taking their radar data, taking their lightning data, taking their satellite data and understanding the formation of that storm and its impact for the next 30 to 40 minutes,” said Schultz. And applications like the ones SPoRT provides to meteorologists allow them to make faster and more confident predictions and get people to safety. “That’s what gives me that warm, fuzzy feeling, when forecasters are able to utilize the things we’ve been working on.”
Modern Lightning Safety in the United States
Last year, the NLDN recorded 20 million lightning flashes that hit the ground in the United States. But as modern, grounded buildings were erected, metal-topped cars proliferated, and the percentage of people working outside went down, fatalities from lightning have gone from around 400 annually in the early 20th century to 27 for the past decade.
Maybe you’ve called your kids in from the yard because you know “When thunder roars, go indoors.” Or perhaps you know the 30-30 rule: When the time between lightning and thunder is less than 30 seconds, it’s not safe to be outside; when 30 minutes have passed since the last strike, it’s safe to go back outside (the rule behind Schultz’s Time Since Last Flash concept).
If so, you can thank Ron Holle, Mary Ann Cooper, and a group of colleagues determined to educate the public on lightning safety. The group met to discuss these ideas in 1998 at the American Meteorological Society conference. The timing (30 seconds, 30 minutes) was based on data they were collecting from the NLDN. Then Holle and Cooper, today known as the preeminent lightning safety experts in the world, went on a media blitz, giving thousands of interviews to local and national reporters to spread these simple messages [Cooper and Holle, 2012].
Even with this progress, Holle, who is now a consultant for Vaisala, argues there’s a long way to go—in developed countries like the United States, that means vulnerability regarding our infrastructure.
“A lot of the power companies are not using lightning data,” Holle said, noting that 50 years ago it may not have been a huge issue if a transformer blew and power went out for an evening, but today, even a few seconds of outage can cause major problems. Nevertheless, Holle said, the list of companies—utilities, airports, major sports facilities—that could still benefit is significant. “It’s a bit frustrating to know that we’re sitting on the data that really could help people.”
The Current That Kills Can Come from Below
Lightning safety is an entirely different issue in developing countries. When thunder roars, go indoors? “Not if you have a thatched roof.”
Lightning safety is an entirely different issue in developing countries. When thunder roars, go indoors? “Not if you have a thatched roof,” said Cooper.
In June 2011, 18 children were killed, and 38 were injured when lightning struck Runyanya Primary School in Uganda. The tragedy moved Richard Tushemereirwe, an adviser on science and technology to the president of Uganda, to found the African Centres for Lightning and Electromagnetics Network, or ACLENet. The organization collects injury data, educates communities on lightning dangers, and raises funds to protect schools and other buildings with lightning safety devices.
The first thing Tushemereirwe did was recruit Cooper to run the organization. (She brought on Holle, who serves on the board.) Cooper is a medical doctor and one of the first experts in modern emergency medicine. She quite literally wrote the book on it—helping to design the first protocols and accreditation standards for the doctors who treat you in the emergency room today. While Cooper was in school, a family friend suffered a high-voltage industrial accident; several years later, it inspired her to give a lecture on electrical injuries at which an attendee asked about lightning injuries. She discovered there was almost nothing published on the topic. She decided to do it herself, searching back through a century of literature for the few documented cases and eventually developing a handful of correlations on location and type of burns and their impact on mortality.
There are five electrical mechanisms through which lightning can kill or injure a person. Only a small percentage of victims are killed or injured by a direct lightning strike. An equally small number are hit through conduction, or contact injury, such as touching a faucet when lightning strikes it. Fifteen to 20% are killed or injured through what’s called a sideflash, the electrical current that strikes outward once lightning has hit something nearby, like a tree.
Another 15% to 20% of victims suffer through a terrifying mechanism called an upward streamer. “As a thunderstorm is coming through the area—it doesn’t even need to be over top of you—this intense, huge electrical field starts, inducing opposite charges in whatever’s underneath it, whether it’s a TV tower or a tree or a person or a cow,” said Cooper. “It turns out that sometimes that opposite charge can be strong enough that an upward streamer will actually start up from the skull of that person or tower.” Sometimes a lightning flash will attach to that upward streaming charge, but it doesn’t have to—the charge itself can be strong enough to kill you. Cooper herself wrote the first medical report on the mechanism after studying the case of a man who was killed during a lightning storm but presented none of the usual high-voltage burns and neither his nearby crew members nor the electrical equipment he was working on suffered any damage. [Cooper, 2002]
But it’s the final mechanism that’s responsible for half of all people killed or injured through lightning: ground current. That is largely the challenge in Africa, where many buildings still have dirt floors, and schools are collections of unsafe buildings in close proximity. In the United States, it’s extremely rare for more than one person to be killed by a single strike; in Africa, it’s not uncommon for groups of 10 or more people to be killed while sitting together in a room—often children attending class.
Cooper and her team presented their data on the high incidents of lightning deaths of African schoolchildren at an international conference in 2014, urging the attendees to focus on safety in schools. The presentation fostered a partnership with German lightning protection company DEHN, and together, they developed a system that was first installed at Runyanya in 2016.
The system starts with a simple lightning rod. “There’s nothing that’s superior to the old-fashioned Ben Franklin lightning rod,” said Cooper. The building is then retrofitted with wires or metal fittings, and the system ends in a ground ring.
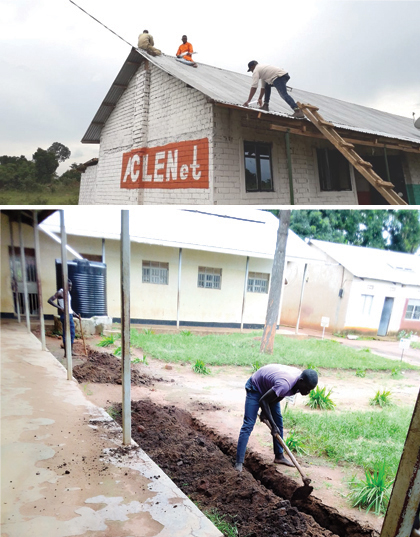
In Runyanya, community members were greatly involved with the project, using their farming tools to dig a trench about a half a meter deep around each building to bury cables, said Holle. “When the lightning hits the building, it comes down the conductors and goes directly into the ground, into this long loop around the building, and dissipates.” It took about 3 days to retrofit all six Runyanya buildings plus a local church.
ACLENet has now protected six schools around Uganda and is currently negotiating some plans with the government to increase and better fund these efforts, including developing workshops in lightning safety building codes for engineers in Africa.
Big Questions Remain on the Big Spark
A better understanding of the mechanisms of lightning itself can better support prediction and mitigation efforts on the ground, researchers say.
“Lightning is just a big spark,” said Bill Rison, a research professor at Langmuir Laboratory for Atmospheric Research at the New Mexico Institute of Mining and Technology in Socorro. “You can measure sparks quite well in the laboratory.” But when researchers compared lab conditions to measurements taken by balloons or aircraft inside storms, he said, “you find that the electric field in the thunderstorm is about an order of magnitude smaller than it would take to generate a spark in the laboratory.”
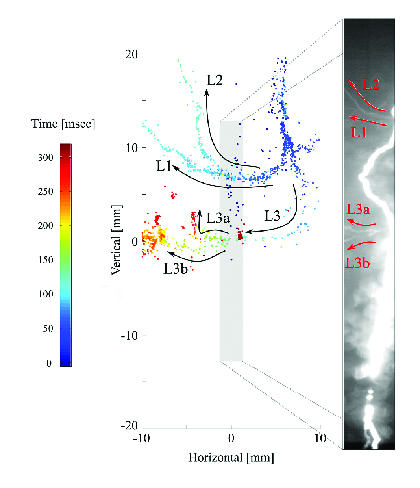
In 1996, Rison was flying back with his colleagues from AGU’s Fall Meeting in San Francisco when they had a bit of an epiphany. They had been working with NASA on a novel very high frequency (VHF) detection system at Kennedy Space Center in Florida that could map lightning flashes in 3-D. But the cost was exorbitant—about $1 million for each of 10 stations. The key to this kind of instrument is highly accurate timing, and highly accurate GPS technology was just becoming available.
These new GPS-based 3-D instruments that make up the Lightning Mapping Array (LMA) cost about 5% of the original NASA stations, which meant Rison’s New Mexico Tech team could deploy them all over. [Rison et al., 1999] Today, there are about 15 of these arrays around the world, and the data they produce are “supercool,” said Vaisala’s Ryan Said. “There are some things we can’t measure,” referring to the NLDN. Unlike radio detectors, VHF instruments can measure all the very small electric discharges that a flash produces to create that detailed 3-D structure. “It’s remarkable,” said Said. “The amount of intuition we have from this research into lightning flashes is ridiculous.”
Lately, Rison’s team has been working in collaboration with the University of Utah, which runs a cosmic ray observatory. Thunderstorms can produce gamma rays, as NASA discovered in the early 1990s, and the Utah team was seeing these terrestrial gamma rays in their data. The New Mexico team already had an LMA in the area, “so now we could actually see characteristics of lightning that were producing the terrestrial gamma ray flashes,” said Rison [e.g., Abbasi et al., 2018]. In 2017, researchers in Japan used instruments outside a nuclear power plant to detect what’s called the relativistic runaway electron avalanches produced by the strong electrical fields in a storm. [Enoto et al., 2017] “Lightning is actually a slow nuclear reactor,” said Rison; his team is working on a new paper from the Utah observations that will offer “more details with exactly what processes of lightning are to generate the terrestrial gamma ray flashes.”
A Second Golden Age
When Chris Schultz looks around at the field of lightning study today, he sees immense progress. “We have a lot of new instrumentation that’s come online in the last 2 years, so we’re trying to integrate all that new information and build a better picture of how that lightning is forming and how it begins in the cloud,” he said.
When Ashley Ravenscraft looked back at the stats for the eight tornados that touched down in northern Alabama in December 2019, she found “we were giving 30 to 45 minutes of lead time” through tornado warnings that told local residents to get to safety. “It tears me up that we had two fatalities, but to not have more is a step in the right direction.”
As researchers build that better picture—through the NLDN and GLD360, through optical images obtained by the GLM in low-Earth orbit, through 3-D lightning mappers—the practical applications for how we protect our communities from dangers of lightning proliferate. Schultz concludes, “We’re in the second golden age of lightning measurement.”
References
Abbasi, R. U., et al. (2018), Gamma ray showers observed at ground level in coincidence with downward lightning leaders, J. Geophys. Res. Atmos., 123, 6,864–6,879, https://doi.org/10.1029/2017JD027931.
Balch, J. K., et al. (2017), Human-started wildfires expand the fire niche across the United States, Proc. Natl. Acad. Sci. U. S. A., 114(11), 2,946–2,951, https://doi.org/10.1073/pnas.1617394114.
Cooper, M. A. (2002), A fifth mechanism of lightning injury, Am. Emerg. Med., 9, 172–174, https://doi.org/10.1197/aemj.9.2.172.
Cooper, M. A., and R. L. Holle (2012), Lightning safety campaigns—USA experience, in 2012 International Conference on Lightning Protection ( ICLP), pp. 1–7, Inst. of Electr. and Electron. Eng., Piscataway, N.J., https://doi.org/10.1109/ICLP.2012.6344289.
Enoto, T., et al. (2017), Photonuclear reactions triggered by lightning discharge, Nature, 551, 481–484, https://doi.org/10.1038/nature24630.
Rison, W., et al. (1999), A GPS-based three-dimensional lightning mapping system: Initial observations in central New Mexico, Geophys. Res. Lett., 26, 3,573–3,576, https://doi.org/10.1029/1999GL010856.
Schultz, C. J., et al. (2019), Spatial, temporal and electrical characteristics of lightning in reported lightning-initiated wildfire events, Fire, 2(2), 18, https://doi.org/10.3390/fire2020018.
Author Information
Heather Goss (@heathermg), Editor
Citation:
Goss, H. (2020), Lightning research flashes forward, Eos, 101, https://doi.org/10.1029/2020EO142805. Published on 24 April 2020.
Text © 2020. AGU. CC BY-NC-ND 3.0
Except where otherwise noted, images are subject to copyright. Any reuse without express permission from the copyright owner is prohibited.