Source: Journal of Geophysical Research: Solid Earth
Iceland is located along the northern Mid-Atlantic Ridge, the volcanically active zone in the center of the Atlantic Ocean where the North American and Eurasian plates are pulling apart from each other at a rate of 18 to 19 millimeters per year. Most of the plate spreading in southern Iceland is accommodated by east–west transform motion in the South Iceland Seismic Zone (SISZ), which lies between two volcanically active centers: Hekla to the east and Hengill to the west.
The resulting strain is released in earthquake sequences that strike at intervals averaging 80 to 100 years. Geodetic research indicates that a series of moderate earthquakes that occurred in this zone in 2000 and 2008 released only half the strain stored in the crust since the previous 1896–1912 sequence.
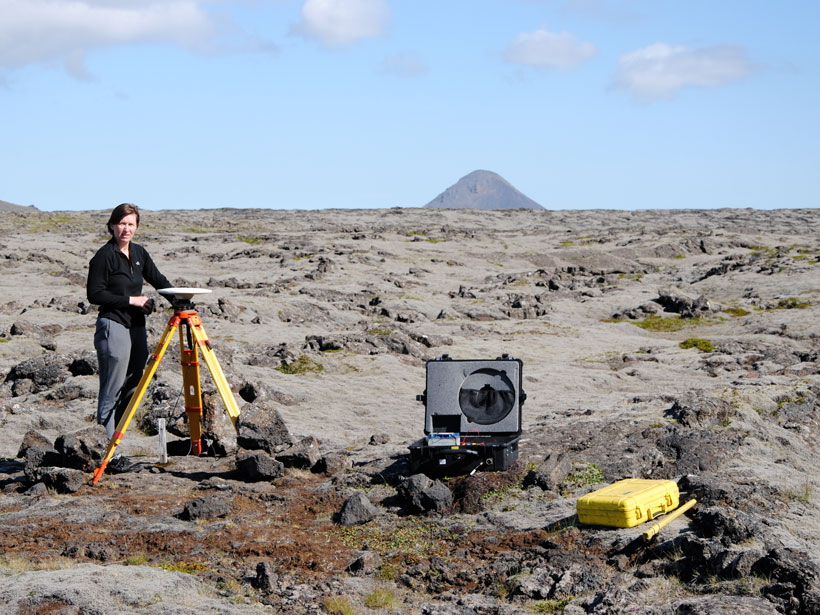
To better understand how the crust is deforming in southern Iceland, Árnadóttir et al. report local strain rates from 2001 to 2015 that they estimated from GPS velocities using a novel method developed in a 2015 study. This technique, which utilizes the vertical derivatives of horizontal stress, minimizes background noise and enables finer resolution than the standard processing method.
The results indicate that crustal deformation in the SISZ includes signals stemming from postseismic activity and plate spreading as well as subsidence in the Hengill area, which the authors attribute to fluid extraction by two local geothermal power plants. Around the Hekla volcano, the researchers also detected a broad area of extension indicative of magma accumulating beneath the edifice. They estimate its volume has increased an average of 0.02 cubic kilometer per year over the 14-year study period.

The authors also discovered a significant increase in the rate of strain in the area where the 2008 earthquakes originated. Because this increase occurred both prior to and following those tremors, the authors hypothesize this signal is caused by a combination of plate motion and subsidence in the Hengill area.
This study clearly demonstrates that the previously published method reveals crustal deformation in southern Iceland not previously observed by standard GPS processing techniques. The resulting maps are allowing geoscientists to visualize crustal deformation in entirely new and potentially important ways. (Journal of Geophysical Research: Solid Earth, https://doi.org/10.1029/2018JB016068, 2018)
—Terri Cook, Freelance Writer
Citation:
Cook, T. (2019), A new way of visualizing Iceland’s crustal deformation, Eos, 100, https://doi.org/10.1029/2019EO121233. Published on 24 April 2019.
Text © 2019. The authors. CC BY-NC-ND 3.0
Except where otherwise noted, images are subject to copyright. Any reuse without express permission from the copyright owner is prohibited.