
Source: Journal of Geophysical Research: Solid Earth
The most powerful and destructive earthquakes (magnitude 8 and higher) happen about once per year. Earthquakes at those magnitudes can do a lot of damage, often causing tsunamis and inflicting devastation across an entire region. The biggest quakes, such as Chile’s 1960 magnitude 9.5 tremor and Japan’s 2011 magnitude 9 event, typically occur in a subduction zone, a section of the Earth’s crust where one massive tectonic plate is sliding beneath another. The pent-up energy of these two plates pressing against one another eventually gives way, creating a colossal earthquake known as a megathrust.
A recent study by Bedford et al. presents a new approach to analyzing signals detected via satellite in the months following a megathrust earthquake. These signals, related to deformation in the tectonic plates caused by stress and strain, can be used to shed light on the tectonic processes that continue to unfold after disaster has struck.
In many recent megathrust earthquakes, continuous GPS monitoring has allowed scientists to observe a two-part process following each quake: afterslip (slow, quiet movement along the interface of the two plates) and viscoelastic relaxation (the process of malleable, deforming rock adjusting to its new state of stress). However, when modeling GPS data collected in the 4 years after a magnitude 8.8 earthquake struck Chile in 2010, the team of researchers noticed something odd.
Usually, before an earthquake, the horizontal ground motion of a continental plate is in roughly the same direction as the subducting oceanic plate because the oceanic plate sticks against—and drags along—the continental plate. During the quake, this observed surface motion is reversed when the sticking point between the two plates suddenly slips.
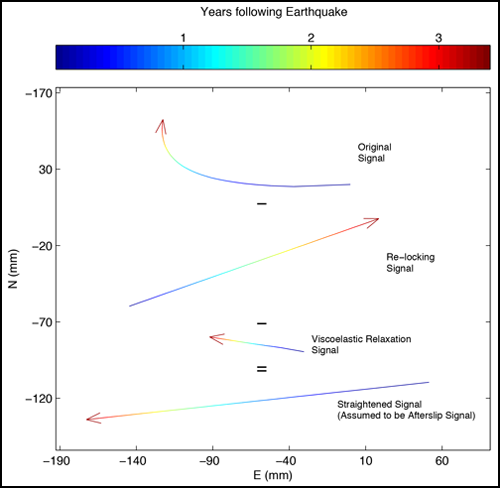
Instead of this usual pattern of horizontal motion due to afterslip and viscoelastic relaxation, however, the researchers saw a distinct curvature in the surface signals. Almost immediately after the quake, the GPS motions started to curve around, starting from roughly the opposite direction of the downgoing plate and shifting toward a direction more in line with the pre-earthquake motion.
The researchers thought that maybe, in addition to afterslip and viscoelastic relaxation, some relocking at the interface of the plates (pumping the brakes, so to speak) might be contributing to the observed curvature. After all, the plate interface must eventually relock in preparation for the next large earthquake. The researchers wondered whether relocking could be a dominant process so soon after a great earthquake. And, if so, how big was its impact relative to the other two processes?
To find out, the researchers applied a novel approach to separating out three different processes: afterslip, viscoelastic relaxation, and plate interface relocking. Their approach, called straightening, assumes that the afterslip motion comes from a nonmigrating afterslip distribution on the plate interface that decays linearly with time. Under these assumptions, the individual contributions of each process can be teased out by finding the combination of relocking and viscoelastic relaxation model predictions that when subtracted from the recorded signal, best reproduces the expected unstraightened afterslip signal features. In other words, they held afterslip to a fixed pattern so that they could vary other parameters to estimate the other components.
Following this method, the researchers discovered that plate interface relocking was indeed the dominant process causing curvature in the signal. Moreover, they were also able to confirm the results of past lab experiments proposing that relocking occurs rapidly, less than a year after an earthquake takes place.
Overall, the study helps provide a more accurate picture of the tectonic processes underlying signals detected after a megathrust earthquake. The researchers hope that in the future their method can be tested at the sites of other megathrust earthquakes, especially those that are well observed by GPS networks. (Journal of Geophysical Research: Solid Earth, doi:10.1002/2016JB013093, 2016)
—Sarah Witman, Freelance Writer
Citation:
Witman, S. (2016), Understanding tectonic processes following great earthquakes, Eos, 97, https://doi.org/10.1029/2016EO063695. Published on 02 December 2016.
Text © 2016. The authors. CC BY-NC-ND 3.0
Except where otherwise noted, images are subject to copyright. Any reuse without express permission from the copyright owner is prohibited.