A translation of this article was made possible by a partnership with Planeteando. Una traducción de este artículo fue posible gracias a una asociación con Planeteando.
Many of us have experienced science communication in the form of dry monologues, unclear scientific journal articles, and complicated technical figures. But we may also have experienced science communicated through exciting visuals such as interactive graphics, animations, or videos. We felt engaged, we were curious, and we wanted to learn more.
Science communication comes in many forms, but the key to success is the same: getting an audience to connect with and absorb the material or message. Today, the need for clear, meaningful, and memorable science communication that engages audiences, from scientists to policymakers to the public, is perhaps greater than ever. This communication is vital because it informs people and prepares them to address modern challenges posed by, for example, the changing global climate and society’s increasing exposure to unpredictable natural hazards and emerging health concerns.
Communicating effectively is a skill that requires preparation and training, and it can be bolstered through collaborations that bring together people with complementary talents.
Communicating effectively is a skill that requires preparation and training, and it can be bolstered through collaborations that bring together people with complementary talents. As educators interested in fostering science communication skills in our students, we brought this lesson into our respective classrooms, forming collaborations between master’s and doctoral students in a graduate geology class (Applied Science Communication) and a junior- and senior-level undergraduate science illustration class (Applications of Science Illustration Techniques) at Iowa State University. Pairs of graduate geology students and undergraduate science illustration majors worked together to develop visual representations and oral presentations of the graduate students’ thesis research to share with a general audience.
The small group size (nine graduate students and 15 undergraduate students) didn’t lend itself to identifying statistically quantifiable conclusions about the project’s outcomes. However, on the basis of feedback from students and audience members and our own observations as facilitators, we believe the collaborations succeeded in enriching the students’ experiences and developing their science communication skills and in engaging a broad audience to connect with the science presented.
Here we share insights about this multifaceted, hands-on collaborative approach, which can be adapted to and applied in other settings at undergraduate and graduate levels.
Joining Forces
The idea for this collaborative project formed as Kim, director of Iowa State University’s Biological and Premedical Illustration (BPMI) major program, started visiting Jacqueline’s structural geology and tectonics class in 2017 to teach the students sketching techniques for field observations. We quickly realized our mutual interest in using illustrations to explain difficult science concepts and observations from nature.
At the time, Jacqueline was already designing a new graduate course in the Department of Geological and Atmospheric Sciences focused on science communication, in which students could experiment with and apply different communication techniques. Science communication still does not routinely appear in graduate Earth science curricula. However, effective communication is an essential tool for scientists today and one that empowers student voices and enables career success.
With this geoscience-focused collaboration, students in both of our classes would have new opportunities.
Communicating science through art is central to the BPMI program, and Kim had previously conducted a similar collaboration between undergraduate BPMI students and biology graduate students in her class on applying illustration techniques.
With this geoscience-focused collaboration, students in both of our classes would have new opportunities. The cohort of BPMI students would broaden their exposure to science by illustrating topics they had not explored before, and they would develop career readiness skills by working with a graduate student “client.” The geology graduate students would use their recently gained communication skills to convey their research accessibly to the illustration majors. In addition, the graduate students’ exposure to the creative artistic process would sharpen their eye for clear, catchy, and effective illustrations—a skill they could later use when making figures for scientific poster presentations or journal articles.
Taking the Idea to the Classroom
To initiate successful collaborations, we paired graduate students with one or two undergraduate students on the basis of their interests and experiences. (Graduate students who were farther along in their thesis projects took part in two separate collaborations to account for the unbalanced numbers of graduate and undergraduate students.)
The geology graduate students first developed short “elevator talks” about their research with the illustration majors in mind. After a class unit in which we discussed how to structure an elevator talk, the students refined their talks in multiple training rounds, relying on fellow graduate students as sounding boards. They were then ready to use their talks to introduce their research to the illustration majors.
We set up a speed interview-like scenario. Each graduate student presented their elevator talk to each illustration major, who then followed with a presentation of their artwork and interests and asked questions about the science. Both groups of students thus practiced succinctly describing their work to people outside their field while also getting a glimpse of the diversity of the two fields. We then gathered the students’ feedback and used it to form the pairings.
Next, the student groups met on their own so the graduate students could describe their research and its societal impacts in more detail for the illustration majors. This set the stage for the illustration students to prepare professional-style creative briefs to define the scope of the artwork to be developed and to serve as a working contract between collaborators. The student groups met several more times, with and without instructor guidance, to develop iterations of a multipart science infographic poster. Each poster featured a visual centerpiece accompanied by supporting graphics and text and was produced in the style of educational placards posted in natural history museums.
To test the efficacy of their work, the student teams presented ideas for and drafts of visuals to target audiences. The feedback generated guided the groups in refining their presentations.
To test the efficacy of their work, the student teams presented ideas for and drafts of visuals to target audiences, including fellow graduate students and faculty in the geology program as well as friends and family members representing the broader public. The feedback generated, such as about what parts of the presentations caught viewers’ eyes and made them want to learn more, guided the groups in refining their presentations.
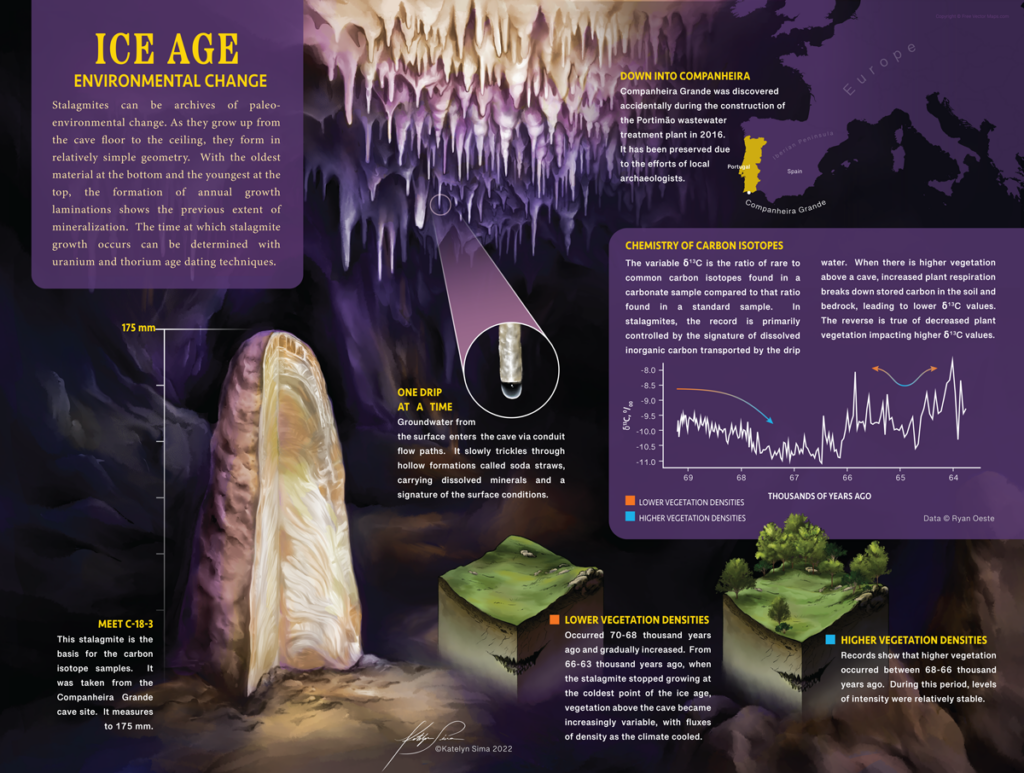
Some feedback helped scientist-illustrator pairs realize they could better relate key visual elements to their intended message. For example, one viewer pointed out how the prominent placement of a timeline on a poster clouded the main message of the presentation. The students’ solution was to set this feature apart in an inset. Another viewer noted on a poster a misleading correlation between stalagmite growth and vegetative growth. This feedback prompted the student team to use color coding to correlate spot illustrations to data points in a graph, resulting in an effective blend of qualitative and quantitative representations.
At this stage, the teams also tested the contrast and visibility of elements on their posters by experimenting with different color palettes and fonts to ensure accessibility for various types of viewers, including those affected by color blindness. Again, feedback from these tests was incorporated into the final posters.
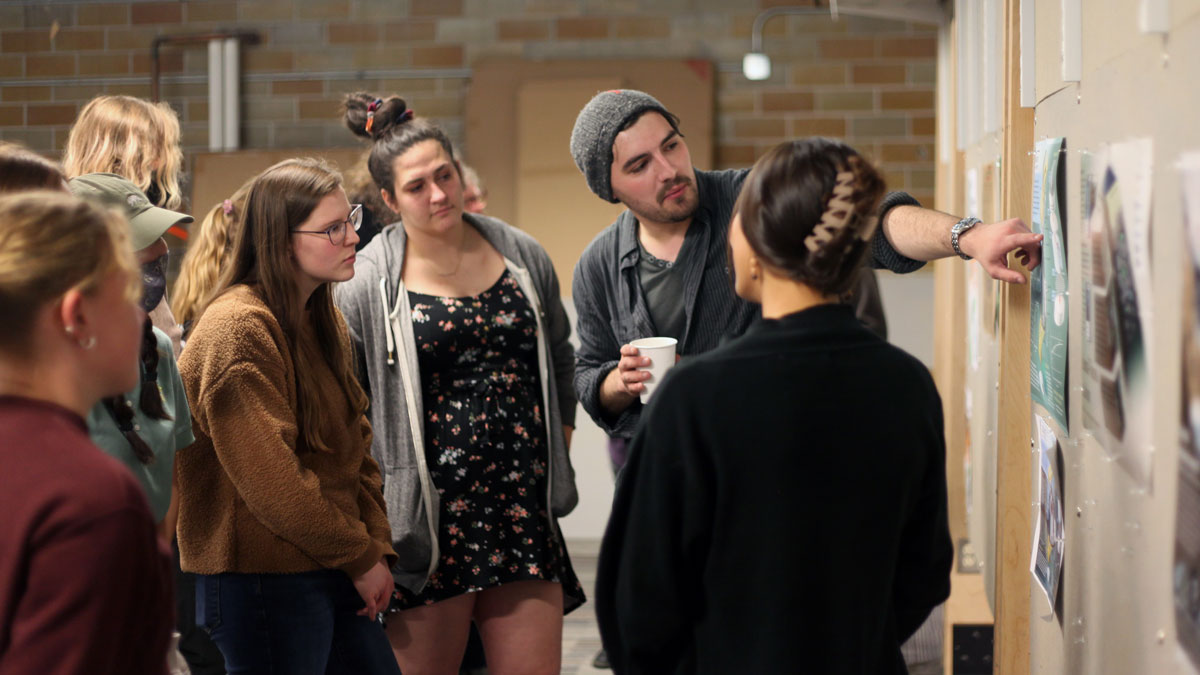
After all the development work, the teams presented their joint works to classmates and instructors at an end-of-semester exhibition modeled after a scientific poster session. Each team explained the scientific background for their poster, walked the audience through their creative process, including how they addressed challenges, and answered questions from the audience.
Struggles, Victories, and Lessons Learned
The students tackled challenges like learning unfamiliar terminology; understanding terms of use and copyright agreements for original art; and ensuring that their posters included good contrast, visible colors, and balanced designs.
This interdisciplinary teamwork forced the students to step outside their comfort zones. The illustration majors produced art pieces on research topics they had never heard of while navigating their partnership with a scientist client. The geology graduate students were exposed to the intensive and iterative process of developing effective visuals for communication and learned to critique practices and visual presentations. All the students tackled challenges like learning unfamiliar terminology; understanding terms of use and copyright agreements for original art; and ensuring that their posters included good contrast, visible colors, and balanced designs to maximize visual impact and accommodate people with vision disabilities. They also struggled with the overarching difficulty of how to develop meaningful take-home messages with their posters.
In their curriculum, BPMI students are taught to implement an iterative content development process to ensure that the primary message of a visual communication piece is clear, meaningful, and engaging for the target audience. As part of this process, the illustrators conducted visual research related to the science they were depicting, which included looking at written descriptions, direct observation, photographs, visual conventions (e.g., using blue for cold and red for hot), maps, illustrations, and video and audio footage. This visual research, combined with input from the graduate geology students, helped them choose how to emphasize critical information and develop prototype visualizations to compare for efficacy.
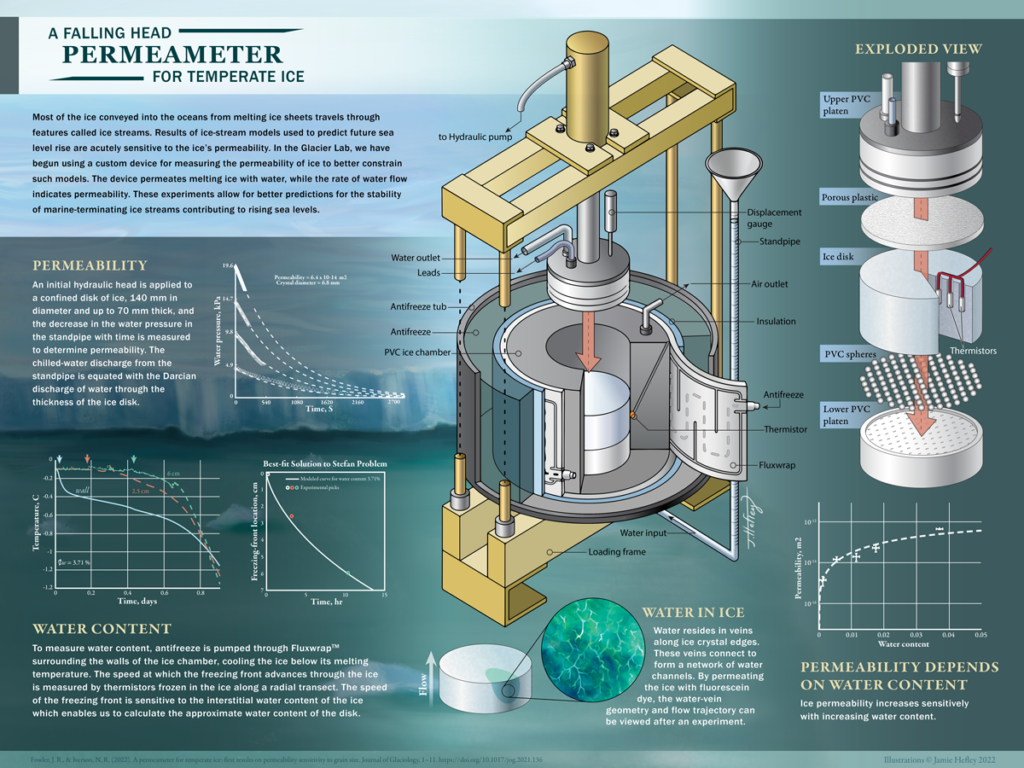
At times, for example, illustrators chose to depict multiple views of an object at once (Figure 1) or change in an object or process (Figure 2) over time. In other cases, they made some poster elements transparent or included detailed insets (Figure 1) and cross sections (Figure 3).

Learning to ask the right questions about their client’s research also helped the BPMI students visualize and decide the best way to portray the content. For example, one illustrator asked how annual growth increments in a marine organism’s calcium carbonate shell vary in thickness relative to historical ocean temperature data. Their partner responded that these variations are visually comparable to tree rings and represent how efficient the organism’s growth was in any given year.
The student pairs themselves had to overcome many small communication hurdles during this process. For example, one of the geology graduate students is studying “force distribution in a granular media.” Depending on your background, that phrase may seem clear or entirely without context. In explaining their research, the graduate student was referring to small, rigid particles, such as sand, simply as grains. Their illustrator partner, who was hearing “grains” and thinking of cereal, was confused as to how the research related to geology. After overcoming the hurdle, the pair decided to focus their communication piece on highlighting similarities among granular systems as diverse as fault gouges, corn kernels, and pharmaceutical pills.

In informal feedback, the geology students said they enjoyed working across disciplinary boundaries and explaining their science to the illustration majors because they could directly see how successful their communication was. They also enjoyed seeing firsthand how the hard-won clarity of the illustrations helped them communicate their research. Some mentioned that tips and tricks they learned through the collaborative work will influence how they design data figures and conference posters for their theses. The illustration students reported gaining confidence in communicating Earth science content and said they enjoyed the hands-on experience of applying their skills to convey current research. Furthermore, some of the pairs continued working together beyond the course project timeline to develop additional materials and options for the research.
An Enriching and Adaptable Model

Scientific illustrations often do what words alone cannot, reaching beyond languages and across disciplinary boundaries and spheres of knowledge to build understanding of technical concepts and imbue meaning for diverse and broad audiences. Indeed, the final communication pieces from our students’ collaborations have been a success with members of the public who have seen them, and they continue to generate interest as they remain displayed in public spaces on the Iowa State campus.
The collaborative experience we designed is not dependent on specific flavors of science or art, so educators from a wide variety of fields could adopt similar approaches in their courses. We certainly encourage them to do so, as the projects proved to be an enriching, effective, and fun experience for both our students and us. Here at Iowa State, we definitely intend to organize these collaborations again in future classes.
Author Information
Jacqueline E. Reber ([email protected]), Department of Geological and Atmospheric Sciences, Iowa State University, Ames; and Kimberly Moss, Biological/Pre-Medical Illustration Program, Department of Art and Visual Culture, Iowa State University, Ames

