
Major earthquakes occur frequently in the subduction zone west of the Andes, the 7,500-kilometer-long mountain belt that runs along the Pacific coast of South America. These earthquakes have been documented since the early expeditions of Alexander von Humboldt and Charles Darwin. Despite all that has been learned through countless investigations across this region over the past few decades, earthquake science and space-based observations [Elliott et al., 2016] can still tell us much more as we await the next “big one.” In particular, detailed knowledge of Earth’s structure and state of stress in seismically active regions is critical for understanding the controls on earthquake generation and for improving hazard assessment, preparation, and response. This knowledge can be obtained using a variety of field-based, instrumental, and experimental techniques.
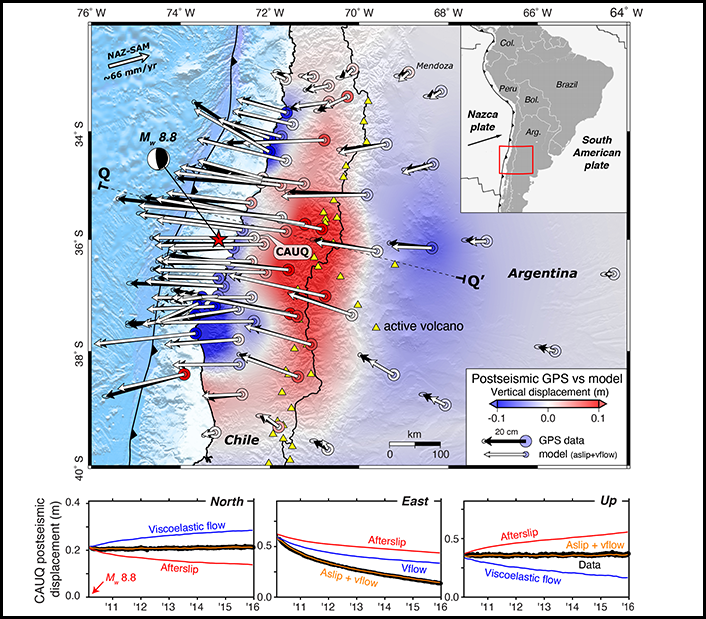
When the moment magnitude (Mw) 8.8 Maule earthquake [Vigny et al., 2011] struck off the coast of central Chile in early 2010, a dense regional network of continuously operating GPS stations was already in place (Figure 1). This was the largest earthquake to occur in the region in 50 years [Melnick et al., 2018], and the GPS network, which spans South America from the Chilean coastline in the west to the rain forests of Brazil in the east, recorded ground movements before, during, and after the event.
Our team used these GPS measurements, coupled with a newly developed numerical modeling technique, to investigate the structure and composition of deep rock in the region surrounding the 2010 earthquake, with the goal of improving our understanding of subduction zone processes, including earthquake generation.
Finding Signals in the Noise
Studying GPS data can reveal detailed information about mountain building over million-year timescales and the short-term behavior of rock in response to earthquake-induced stress changes.
One member of our team, Jonathan Weiss, has spent years investigating the process of mountain building, called orogenesis. Weiss uses the GPS instruments, which are similar to but much more sensitive than those in your cellular phone, to measure horizontal and vertical ground motions as small as a few millimeters per year. Studying the GPS data can reveal detailed information about the forces responsible for mountain building over million-year timescales, the short-term behavior of rock in response to earthquake-induced stress changes, and even seasonal cycles of rainfall in the Amazon basin.
In past work investigating the central Andes in southern Bolivia, where the seismic hazard may be drastically underestimated [Brooks et al., 2011], Weiss and colleagues used GPS time series measurements to quantify deformation rates during the time period between major subduction zone earthquakes in Peru and Chile (i.e., the interseismic phase of the subduction zone earthquake cycle) [Wang et al., 2012; Weiss et al., 2016].
In addition to the interseismic signal, these time series also contained signals associated with both coseismic deformation (rapid surface displacement that occurs during an earthquake) and postseismic deformation (characteristic transient surface motion that typically occurs after large events). Postseismic deformation can occur for months to years following large subduction zone earthquakes and is thought to reflect the combined effect of continued slip on the subduction zone interface after the main event (afterslip) and the flow of viscoelastic material in the lower crust and upper mantle (relaxation). At the time, Weiss viewed the coseismic and postseismic signals as unrelated to the slow accumulation of tectonic strain occurring between earthquakes and associated with mountain building, and he therefore put significant effort into characterizing and removing these so-called postseismic transients from the GPS data.
Subsequently, Weiss met Qiu Qiang, known familiarly as “QQ,” while both were working at the Centre for the Observation and Modelling of Earthquakes, Volcanoes and Tectonics (COMET) at the University of Leeds in the United Kingdom. The two began discussing mutual research interests, including how to interpret the postseismic transients, a topic QQ worked on extensively while analyzing earthquakes in Sumatra [Qiu et al., 2018]. At the suggestion of COMET director Tim Wright, they used GPS measurements from South America and applied a new numerical modeling method developed by Sylvain Barbot from the University of Southern California and expanded upon by QQ.
Our team was excited to test the limits of this new method while probing Earth’s structure beneath a portion of the southern Andes.
The method involves geophysical data inversion: Rather than starting with rock parameters like viscosity and layer thickness to build a simulation of the surface motion recorded in the GPS data (i.e., a forward model), the approach starts with the postseismic surface displacement time series measured at each GPS site. It then back-calculates (inverts for) the time-varying distribution of afterslip on the megathrust fault and the viscous stress and strain rate in the lithosphere-asthenosphere system (the brittle rock of Earth’s crust and the ductile mantle rock below) that produced the observed deformation (Figure 1). The stress-strain rate information, in turn, can be used to estimate changes in lower crustal and upper mantle viscosity thought to occur in response to large earthquakes. Thus, the approach can reveal information about rock mechanical properties using surface motion measurements alone while requiring significantly less computational time and resources than commonly used forward modeling methods.
Our team, which includes QQ, Barbot, Wright, and collaborators in the United States and South America, was excited to test the limits of this new method while probing Earth’s structure beneath a portion of the southern Andes. We analyzed postseismic GPS data from the Maule earthquake recorded by the South American GPS network. This network, installed and maintained by numerous government agencies, academic institutions, and international research groups, provides a detailed view of Maule-related surface deformation, particularly when compared with records of other recent giant (Mw ≥ 8.5) subduction earthquakes that occurred either far out at sea (e.g., Tohoku-Oki) or where coverage by geodetic networks was sparse (e.g., Sumatra) [Fujiwara et al., 2011; Qiu et al., 2018].
Maule’s Story
The Maule postseismic data show a complex displacement pattern associated with fault slip near the coast and viscous relaxation (flow) in the lower crust and upper mantle in the region surrounding the earthquake and extending eastward across the spine of the high Andes to the foreland basin of western Argentina [Weiss et al., 2019].
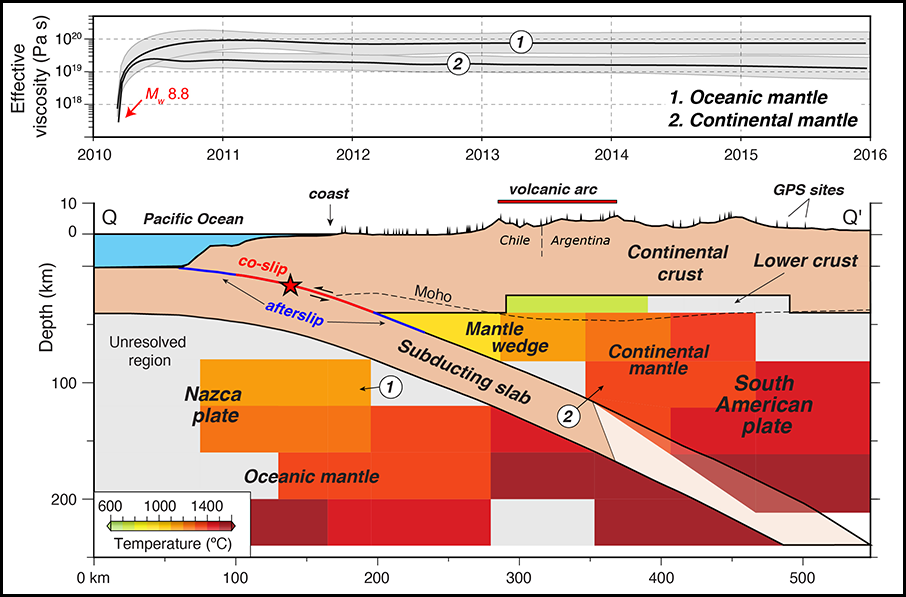
Using the new modeling approach, our team mapped the time-varying viscosity structure of the region, including a rapid, nearly 100-fold increase in viscosity that occurred during the first few weeks after the earthquake (Figure 2). Other newly identified features include a large viscosity contrast between the upper mantle portions of the subducting Nazca and overriding South American plates, a relatively strong (i.e., high-viscosity) mantle wedge corner near the intersection of these two plates, and a strong lower crust beneath the Andean volcanic arc.
Our observations reveal the locations where coseismic slip is most likely to reach the seafloor and potentially cause a tsunami in the event of future large earthquakes in the same region.
We also tracked the time evolution of afterslip on the megathrust and found that most of this slip (up to 8 meters) occurred at shallow depths above and partially surrounding the main rupture zone. This pattern differs from previous studies that suggest primarily deep afterslip, but it is required to explain the nearshore vertical displacement pattern seen with GPS. Our analysis of the afterslip also indicated that friction along the megathrust fault in the vicinity of the Maule earthquake is highly variable and partially controlled by the local geology of the upper plate, which can result in shallow slip behavior that differs over short distances. This observation reveals the locations where coseismic slip is most likely to reach the seafloor and potentially cause a tsunami in the event of future large earthquakes in the same region.
We took this work one step further by exploiting well-known, experimentally determined flow laws [Bürgmann and Dresen, 2008] that relate stress and strain rate as rock deforms. In ductile regions, rock strength is controlled by several rheological parameters, and we were able to estimate two of these elusive but important controls on ductile flow at depth in the region surrounding the earthquake: temperature distribution and water content (Figure 2). These parameters exert strong controls on the size of the seismogenic zone and on arc volcanism and subduction zone dynamics. For example, the weak lower crust beneath the Andes is wet, indicating the presence of partial melt or fluids beneath the volcanic arc. Also, the strong, cold, and wet mantle wedge corner and the sharp thermal gradient between it and the adjacent hot and wet upper mantle help to maintain conditions that promote earthquake nucleation.
A New Piece of the Puzzle
Our study confirms that the combination of a dense network of GPS sites and the new inversion algorithm can significantly increase our knowledge of subduction zone structure, rheology, and the state of stress in seismically active regions. These factors ultimately control the distribution and frequency of large earthquakes and volcanic activity.
This work provides a new piece of the puzzle that may aid scientists in determining when and where destructive earthquakes will occur. We are currently extending our analysis along the Chilean coast to the north. We believe that the surface displacements associated with recent large subduction earthquakes recorded in the GPS data in this region will help reveal additional details of the geodynamics of the South American margin and further our understanding of subduction zones worldwide.
References
Brooks, B. A. et al. (2011), Orogenic-wedge deformation and potential for great earthquakes in the central Andean backarc, Nat. Geosci., 4(6), 380–383, https://doi.org/10.1038/ngeo1143.
Bürgmann, R., and G. Dresen (2008), Rheology of the lower crust and upper mantle: Evidence from rock mechanics, geodesy, and field observations, Annu. Rev. Earth Planet. Sci., 36(1), 531–567, https://doi.org/10.1146/annurev.earth.36.031207.124326.
Elliott, J. R., R. J. Walters, and T. J. Wright (2016), The role of space-based observation in understanding and responding to active tectonics and earthquakes, Nat. Commun., 7, 13844, https://doi.org/10.1038/ncomms13844.
Fujiwara, T., et al. (2011), The 2011 Tohoku-Oki earthquake: Displacement reaching the trench axis, Science, 334(6060), 1240, https://doi.org/10.1126/science.1211554.
Henderson, S. T., and M. E. Pritchard (2017), Time-dependent deformation of Uturuncu volcano, Bolivia, constrained by GPS and InSAR measurements and implications for source models, Geosphere, 13(6), 1,834–1,854, https://doi.org/10.1130/GES01203.1.
Melnick, D., et al. (2018), Back to full interseismic plate locking decades after the giant 1960 Chile earthquake, Nat. Commun., 9(1), 3527, https://doi.org/10.1038/s41467-018-05989-6.
Qiu, Q., et al. (2018), Transient rheology of the Sumatran mantle wedge revealed by a decade of great earthquakes, Nat. Commun., 9(1), 995, https://doi.org/10.1038/s41467-018-03298-6.
Vigny, C., et al. (2011), The 2010 Mw 8.8 Maule megathrust earthquake of central Chile, monitored by GPS, Science, 332(6036), 1,417–1,421, https://doi.org/10.1126/science.1204132.
Wang, K., Y. Hu, and J. He (2012), Deformation cycles of subduction earthquakes in a viscoelastic Earth, Nature, 484(7394), 327–332, https://doi.org/10.1038/nature11032.
Weiss, J. R., et al. (2016), Isolating active orogenic wedge deformation in the southern Subandes of Bolivia, J. Geophys. Res. Solid Earth, 121(8), 6,192–6,218, https://doi.org/10.1002/2016JB013145.
Weiss, J. R., et al. (2019), Illuminating subduction zone rheological properties in the wake of a giant earthquake, Sci. Adv., 5(12), eaax6720, https://doi.org/10.1126/sciadv.aax6720.
Author Information
Simon Schneider ([email protected]) and Jonathan R. Weiss, Institute of Geosciences, University of Potsdam, Germany
Citation:
Schneider, S.,Weiss, J. R. (2021), Using earthquake forensics to study subduction from space, Eos, 102, https://doi.org/10.1029/2021EO153411. Published on 19 January 2021.
Text © 2021. The authors. CC BY-NC-ND 3.0
Except where otherwise noted, images are subject to copyright. Any reuse without express permission from the copyright owner is prohibited.