Scientists identify barriers to and opportunities for applying integrated, connected, open, and networked research strategies to natural hazards studies.
data management

Posted inOpinions
Overcoming the Challenges of Ocean Data Uncertainty
In oceanography, as in any scientific field, the goal is not to eliminate uncertainty in data, but instead to better quantify and clearly communicate its size and nature.

Posted inNews
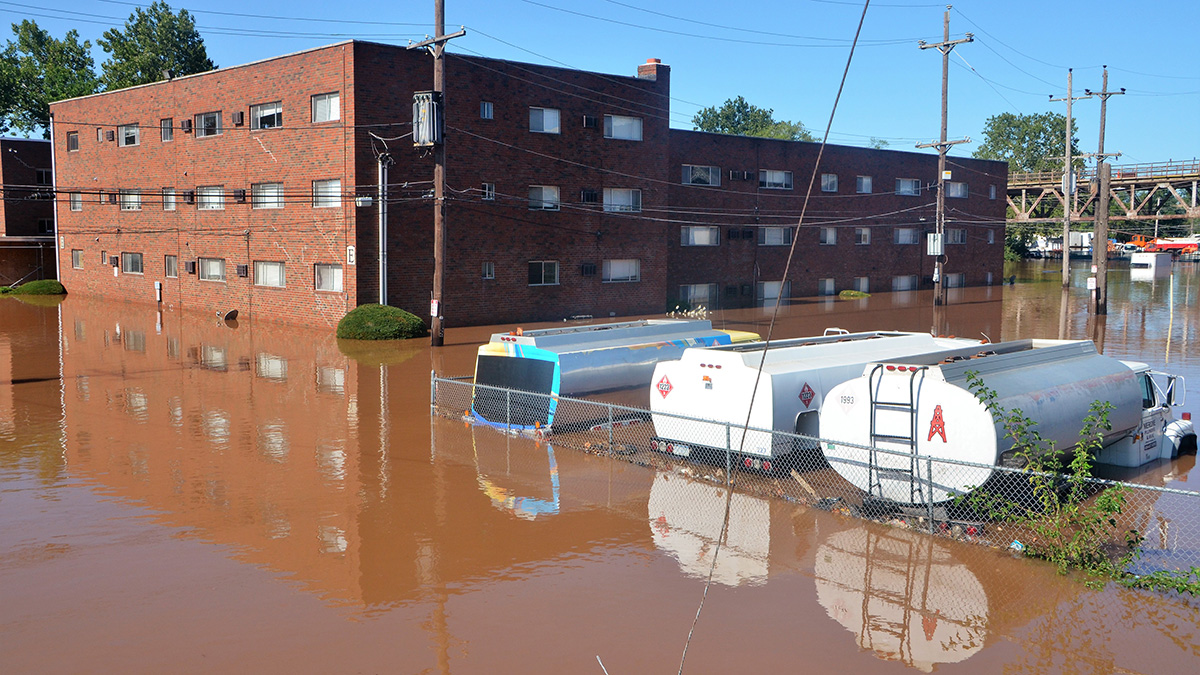
Una nueva herramienta crea rápida y gratuitamente mapas de inundaciones para el sur global
Un nuevo programa en línea puede trazar rápidamente los contornos de inundaciones pasadas, permitiendo que los países con escasez de datos se preparen para futuros desastres.

Posted inNews
New Tool Crafts Fast, Free Flood Maps for the Global South
A new online program can quickly map the outlines of past floods, allowing data-scarce countries to prepare for future disasters.
Posted inEditors' Highlights
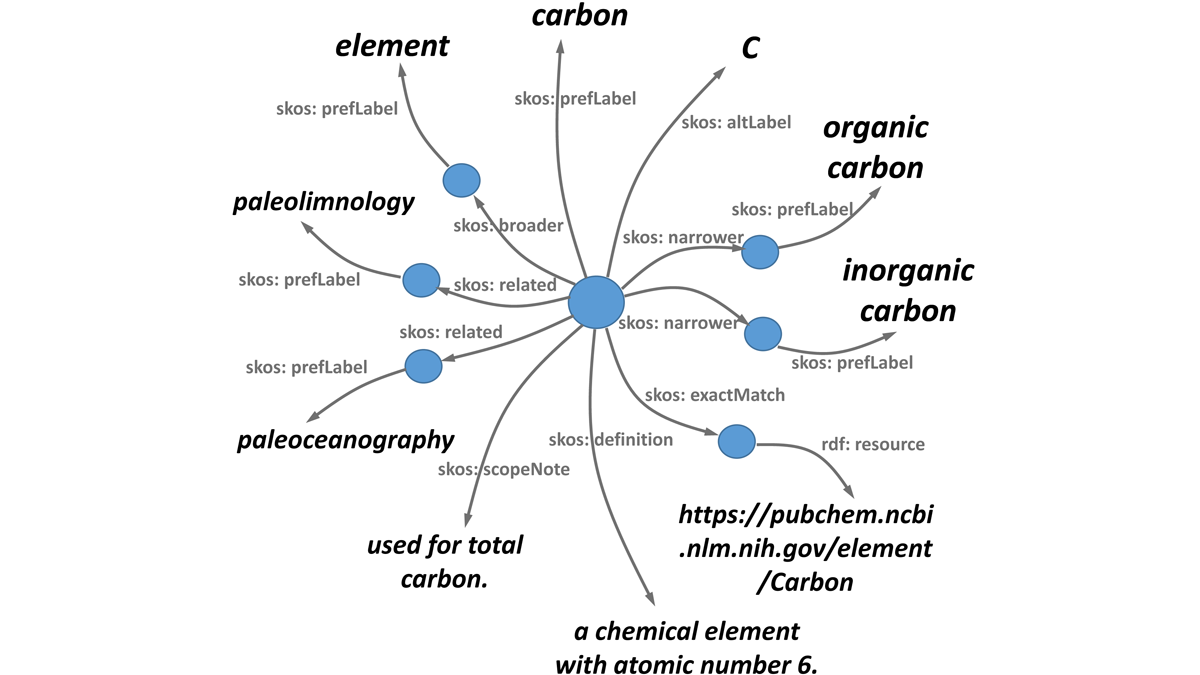
Finding the Right Words: A Common Language for Data Deposition
Discovering climate signals in the archives: how using a common language for data deposition ensures your data are found, understood and cited.
Posted inEditors' Highlights
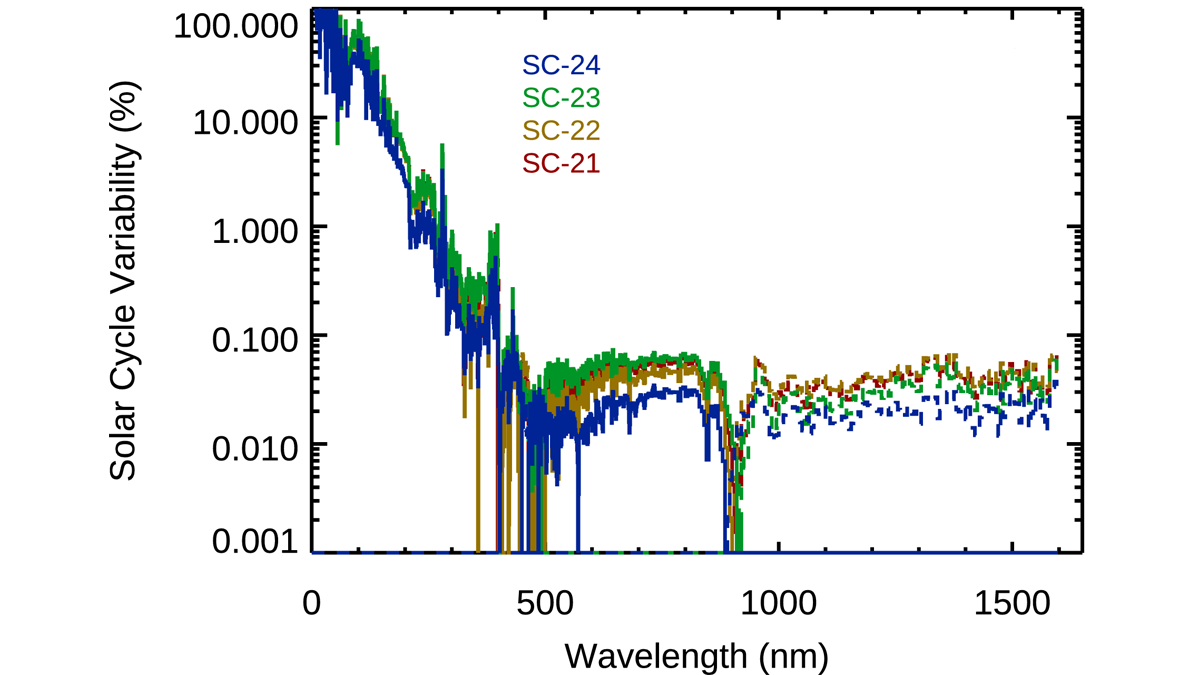
Newly Improved Solar Spectral Irradiance Composite Record
A new study accurately captures solar irradiance, which is crucial to understand the energetics and radiation balance of Earth and its influences on the cryosphere, atmosphere, and ocean currents.

Posted inScience Updates
Anticipating Climate Impacts of Major Volcanic Eruptions
NASA’s rapid response plan for gathering atmospheric data amid major volcanic eruptions, paired with efforts to improve eruption simulations, will offer better views of these events’ global effects.

Posted inNews
Tracking Sustainability Goals with Creative Data Sources
Nontraditional sources of data could assist in charting the U.N. Sustainable Development Goals, helping design appropriate policies and investments to improve the state of the environment.

Posted inEditors' Vox
A New Practical Guide to Using Python for Earth Observation
A new book presents an example-driven collection of basic methods, applications, and visualizations to process satellite data sets for Earth science research.
Posted inResearch Spotlights
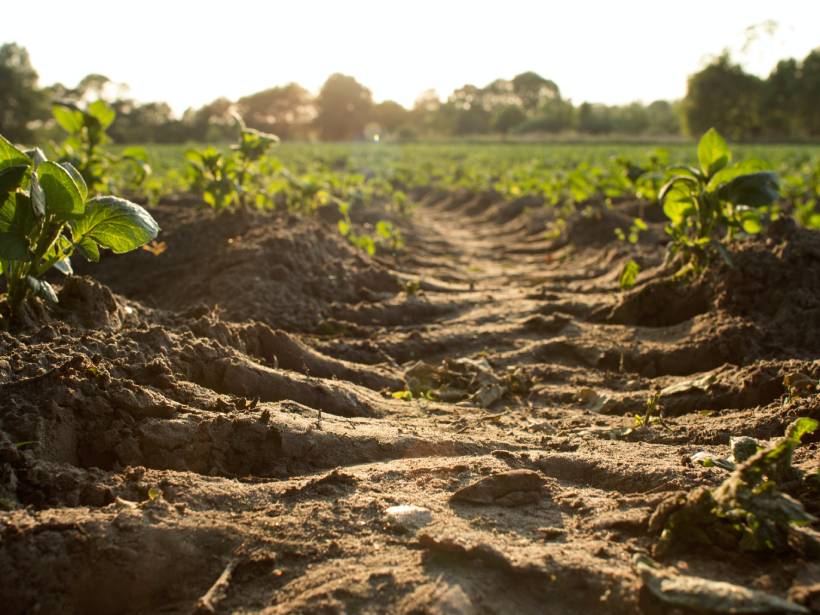
Una mirada global al carbono orgánico superficial del suelo
El carbono orgánico del suelo es un elemento importante para la salud de los ecosistemas y del clima. En la actualidad la teledetección permite a los científicos observar globalmente esta importante pieza del rompecabezas del carbono.