
By adding support for spatially variable velocity fields and anisotropy, the CoSMoS simulation package can more accurately reproduce physical phenomena.
Modeling

Posted inEditors' Highlights
The Great Unconformities?
New thermochronology data and thermal history modeling from the Canadian Shield show that the Great Unconformity formed there later than elsewhere in North America and may represent another event.
Posted inResearch Spotlights
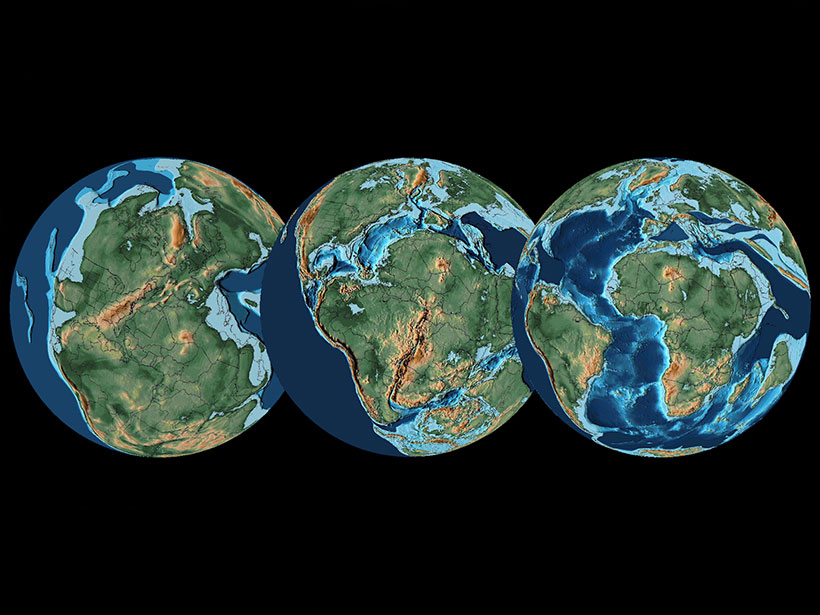
Simulating 195 Million Years of Global Climate in the Mesozoic
An ensemble of climate simulations identifies factors that drove long-term trends of a prehistoric greenhouse climate.
Posted inEditors' Highlights
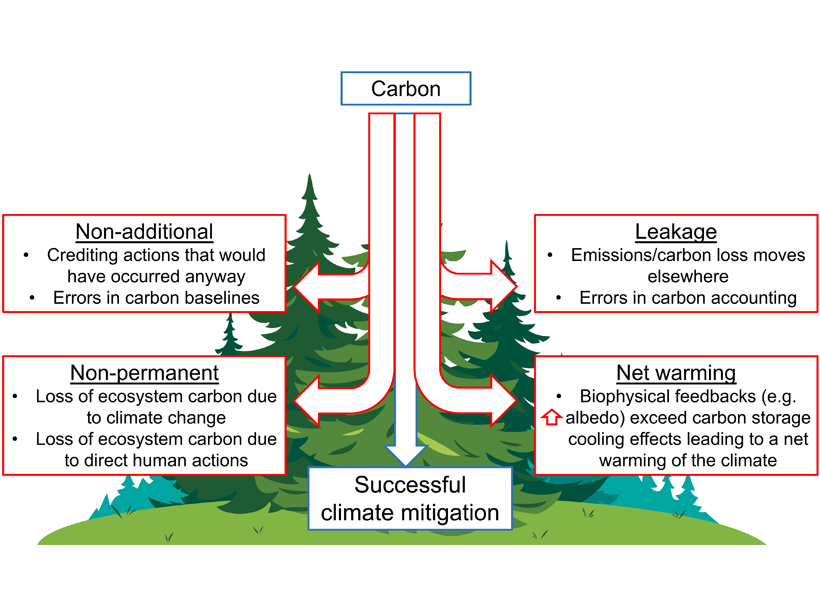
Permanence of Nature-Based Climate Solutions at Risk
Conserving native ecosystems helps sequester carbon and mitigate climate change, but new statistical modeling questions the permanence of California’s carbon-rich forests with climate change.

Posted inResearch Spotlights
A New Method Produces Improved Surface Strain Rate Maps
The transdimensional Bayesian approach handles GPS data limitations better than existing methods and may assist future seismic hazard assessment studies.

Posted inEditors' Vox
Call for Papers on Machine Learning and Earth System Modeling
Contributions are invited to a new journal special collection on the use of new machine learning methodologies and applications of machine learning to Earth system modeling.

Posted inResearch Spotlights
Una mirada global al carbono orgánico superficial del suelo
El carbono orgánico del suelo es un elemento importante para la salud de los ecosistemas y del clima. En la actualidad la teledetección permite a los científicos observar globalmente esta importante pieza del rompecabezas del carbono.
Posted inEditors' Highlights
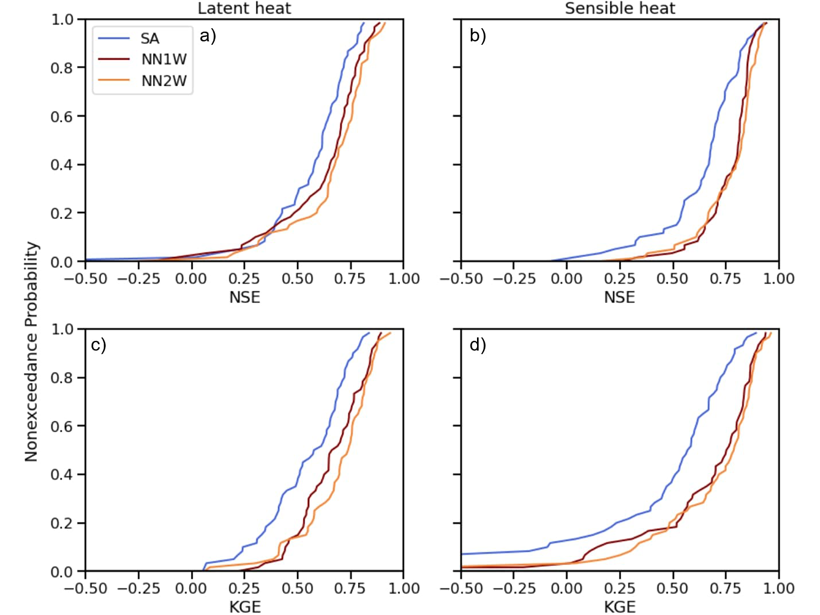
Combining Deep Learning Methods with Process-based Models
Using turbulent heat fluxes as an example, a new study shows that exchange of information between process-based models and deep learning methods may lead to improved predictions.

Posted inEditors' Highlights
A New Model for Self-Organized Pattern Formation
Scale-dependent feedbacks in time, rather than in space, result in a new type of competition, explaining the regularly patterned landscape of Big Cypress National Preserve in South Florida.
Posted inEditors' Highlights
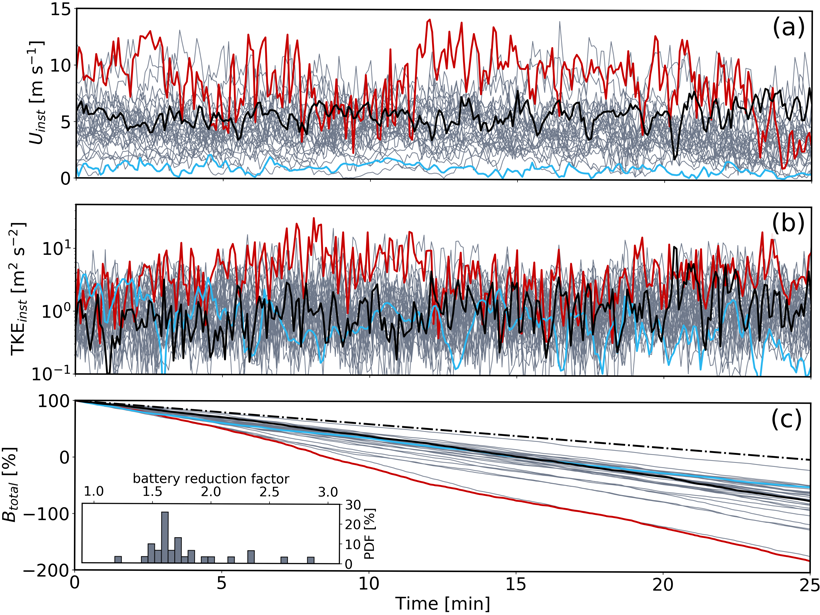
Modeling Urban-Weather Effects Can Inform Aerial Vehicle Flights
Microscale modeling can be used to understand and predict urban weather with sufficient detail to inform and support flight safety for crewed and uncrewed aerial vehicles.