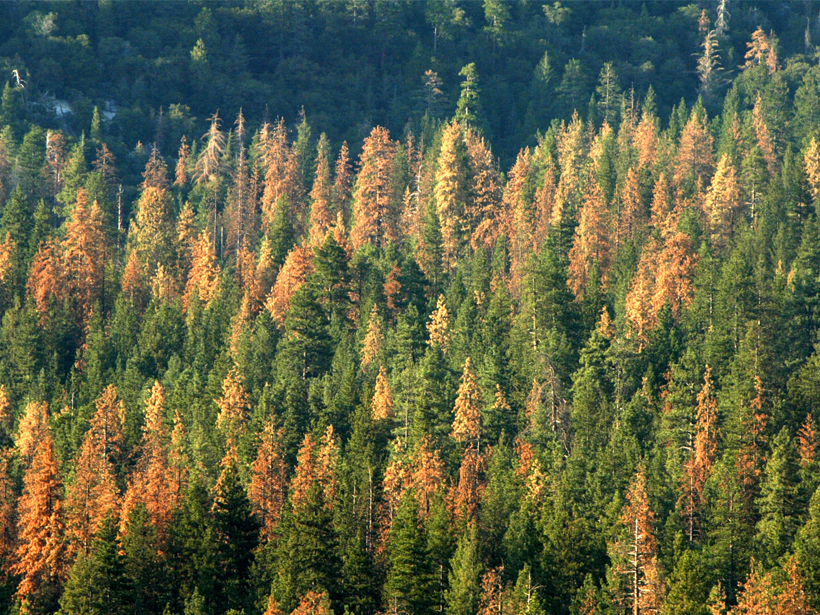
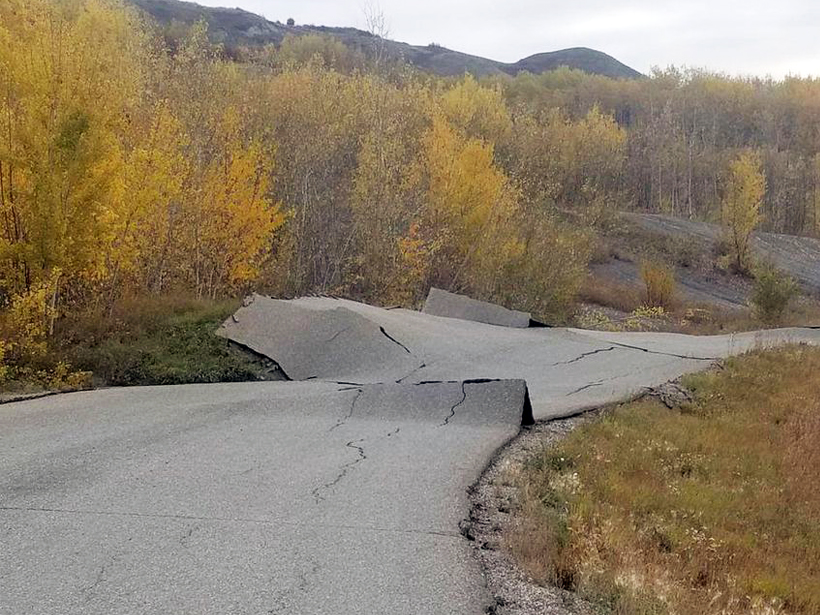
A satellite-based early-warning signal may spot the start of a forest’s decline and give forest managers more time to save its life.
remote sensing

Posted inScience Updates
Gas Bubble Forensics Team Surveils the New Zealand Ocean
An international research group recorded the acoustic signatures of gas bubbles rising from a hydrothermal vent field to gather clues about greenhouse gases escaping into the atmosphere.
Posted inScience Updates
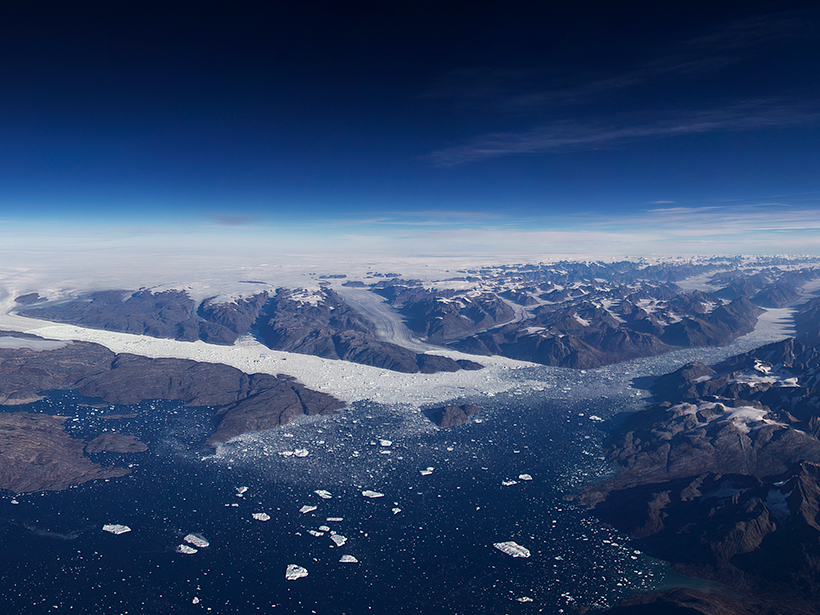
New Earth Orbiter Provides a Sharper Look at a Changing Planet
A first look at data from NASA’s laser altimeter mission ICESat-2 reveals very high resolution 3-D profiles of ice on land and sea, forests, and shallow bodies of water.
Posted inEditors' Highlights
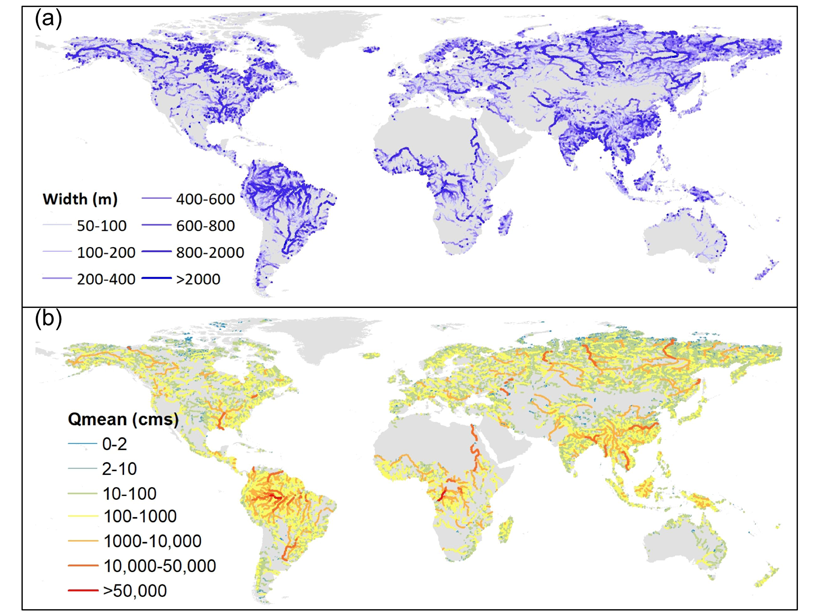
Reconstructing Natural Streamflow at Unprecedented Resolution
A new research effort has mapped 35 years of naturalized streamflow for 2.94 million river reaches worldwide: an invaluable dataset for hydrology, biogeochemistry, ecology, and remote sensing.
Posted inEditors' Highlights
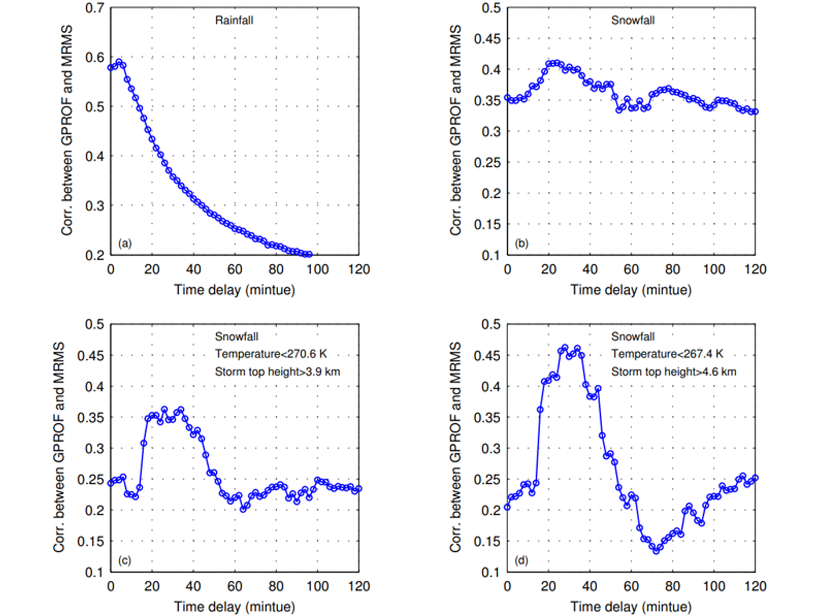
Accounting for the Fact that Snow Falls Slower than Rain
When calibrating satellite observations with ground-based ones, estimated precipitation rates are improved by considering that snow takes longer to fall compared to rain.
Posted inNews
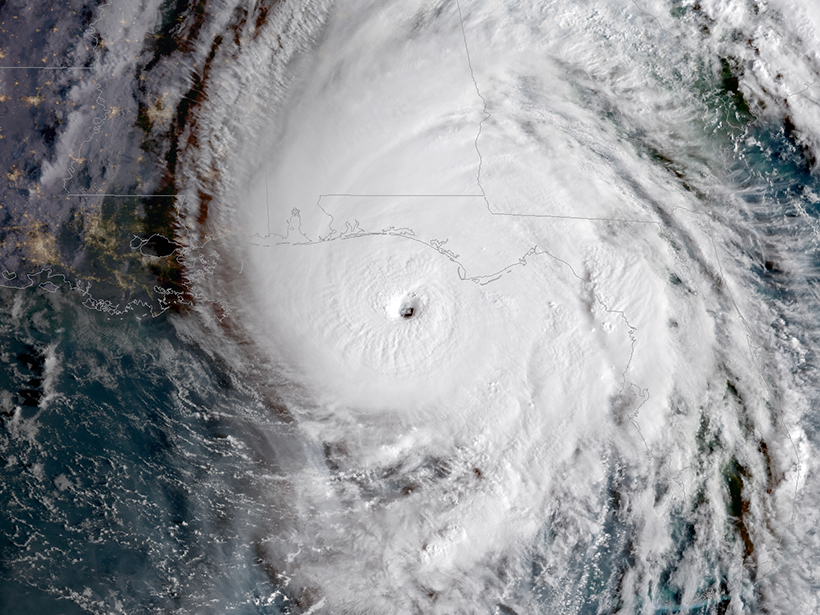
Rainfall Kick-Starts Slow-Moving Landslides
A census of hundreds of slow-moving landslides in Northern California reveals an uptick in the number and speed of landslides in 2017, the second-wettest year on record.

Posted inScience Updates
Satellite Oceanography Data Producers and Users Connect
First International Operational Satellite Oceanography Symposium; College Park, Maryland, 18–20 June 2019

Posted inResearch Spotlights
Capturing Snowmelt Patterns from Cloudy Satellite Images
A new modeling strategy could improve streamflow predictions in places where mountain snow is a critical source of water.
Posted inOpinions
Artificial Intelligence May Be Key to Better Weather Forecasts
Recent advances in machine learning hold great potential for converting a deluge of data into weather forecasts that are fast, accurate, and detailed.
Posted inResearch Spotlights
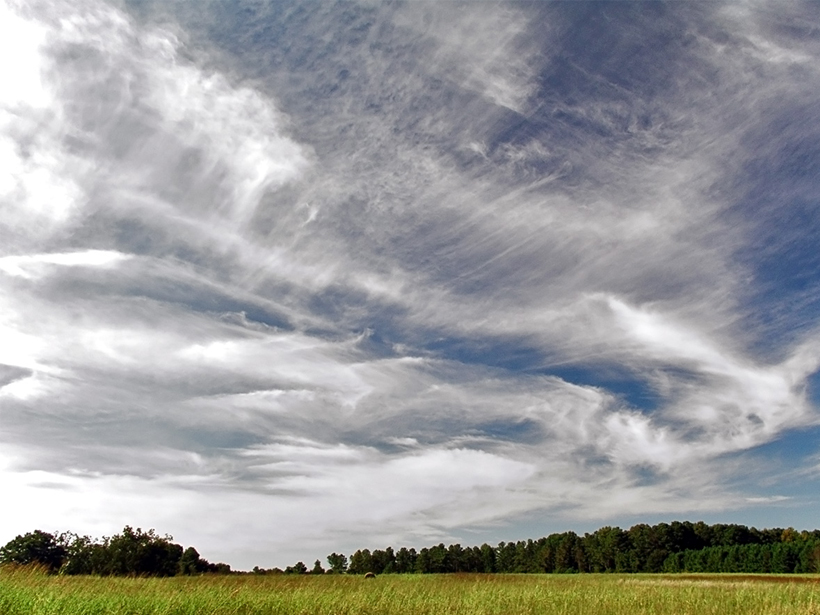
A Better Way to Measure Cloud Composition
An enhanced satellite remote sensing suite accurately measures ice particles, temperature, and water vapor.