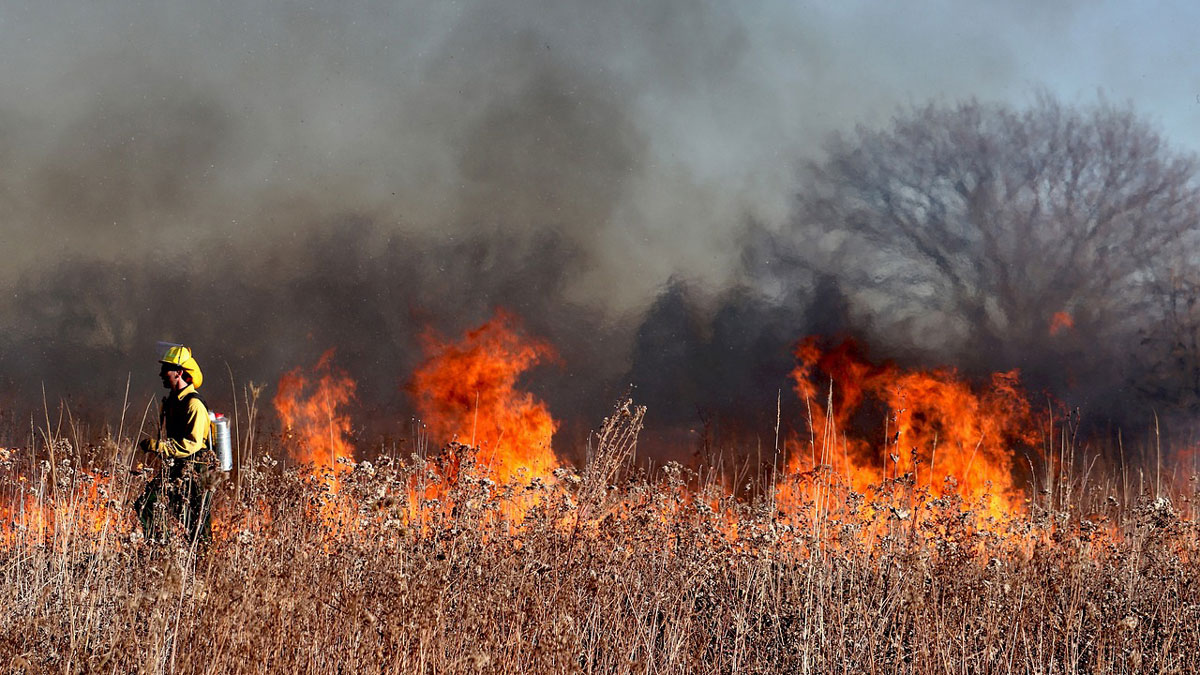
Longer, drier summers may mean fewer opportunities for firefighters to safely burn would-be wildfire fuel in the western United States.
weather

Posted inNews
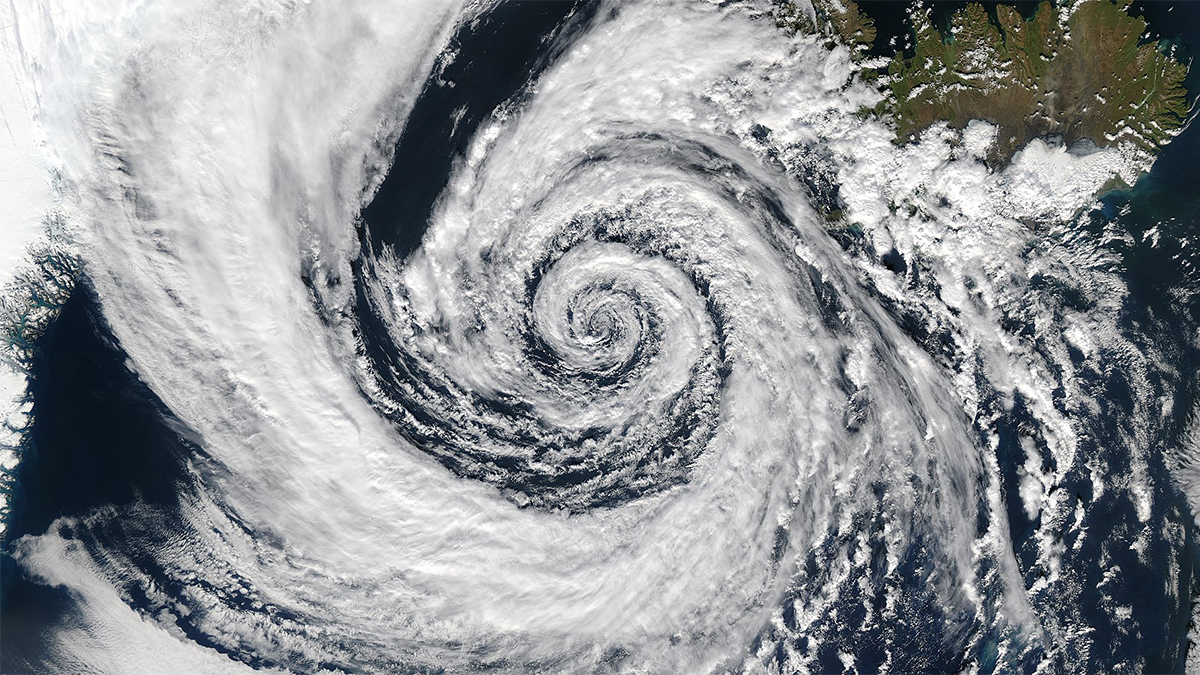
River Recovery from Drought Can Take Years
Climate change has created increasingly volatile weather and a drier atmosphere, making it harder for rivers to recuperate after a drought.
Posted inResearch Spotlights
AI Meets Its Match: The Butterfly Effect
Artificial intelligence algorithms fail to account for a key limitation in weather prediction.

Posted inNews
Crowdsourced Science Pulls Off a Daring WWII Data Rescue
Newly declassified documents are making wartime weather observations in the Pacific Theater more robust, and could improve climate models today.
Posted inEditors' Highlights
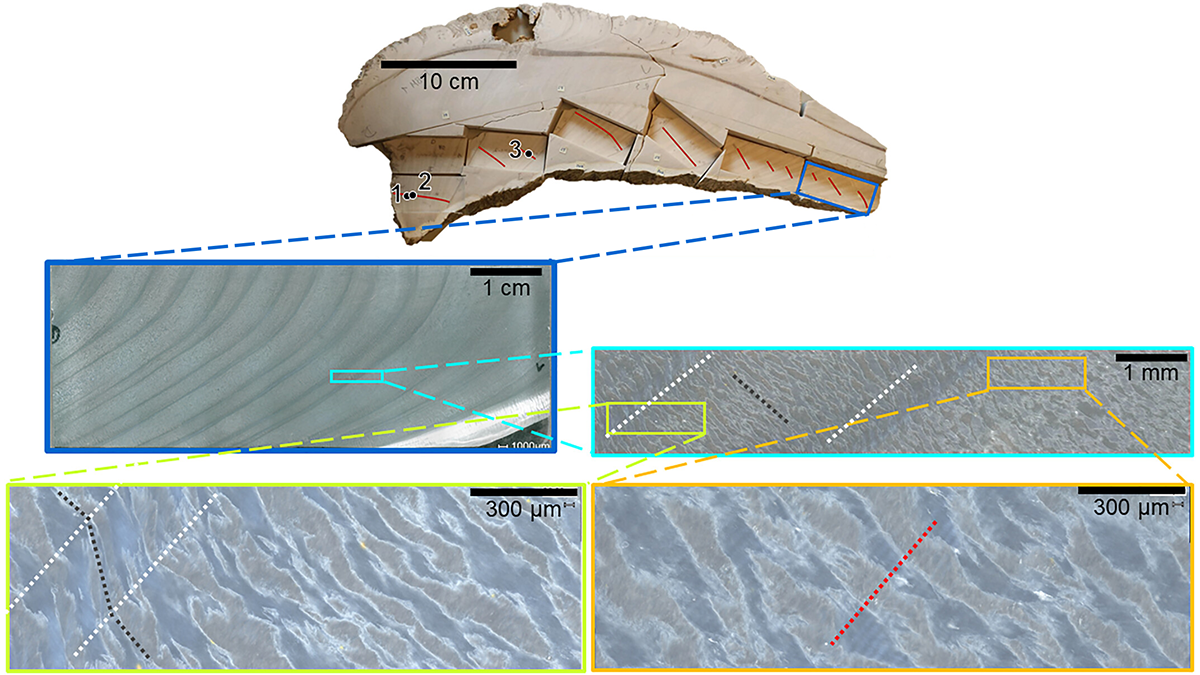
Ultra-High-Resolution Age Model in Clams Yields Daily Paleo-Data
Using geochemical techniques, scientists identify daily cycles in fossilized giant clams, which permits climate reconstructions at the weather timescale.

Posted inEditors' Highlights
Meteorological Uncertainty Shapes Global Hydrological Modeling
A new study examines the effects of spatiotemporal precipitation uncertainty on key hydrologic processes, including runoff and soil moisture, in a comprehensive sample of 289 cryosphere regions.
Posted inNews
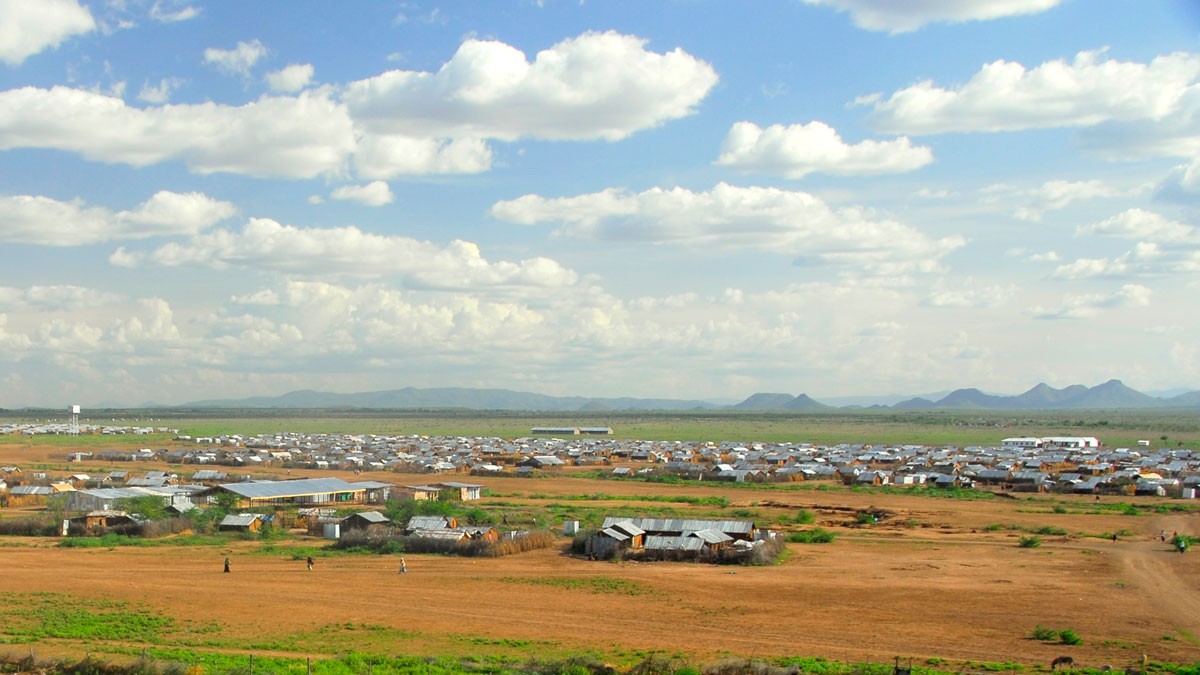
Displaced from Home and Sheltered in an Extreme Environment
Millions of people, displaced from their home countries, take refuge in areas that are highly vulnerable to extreme weather.

Posted inFeatures
Jen Walton: Chaser of Storms and Lava
Walton founded Girls Who Chase to promote women in STEM.
Posted inFeatures
WMO Weathered the Cold War, but Can It Survive Capitalism?
After 150 years of international cooperation, meteorology’s “vast machine” is adapting to private weather forecasting.
Posted inNews
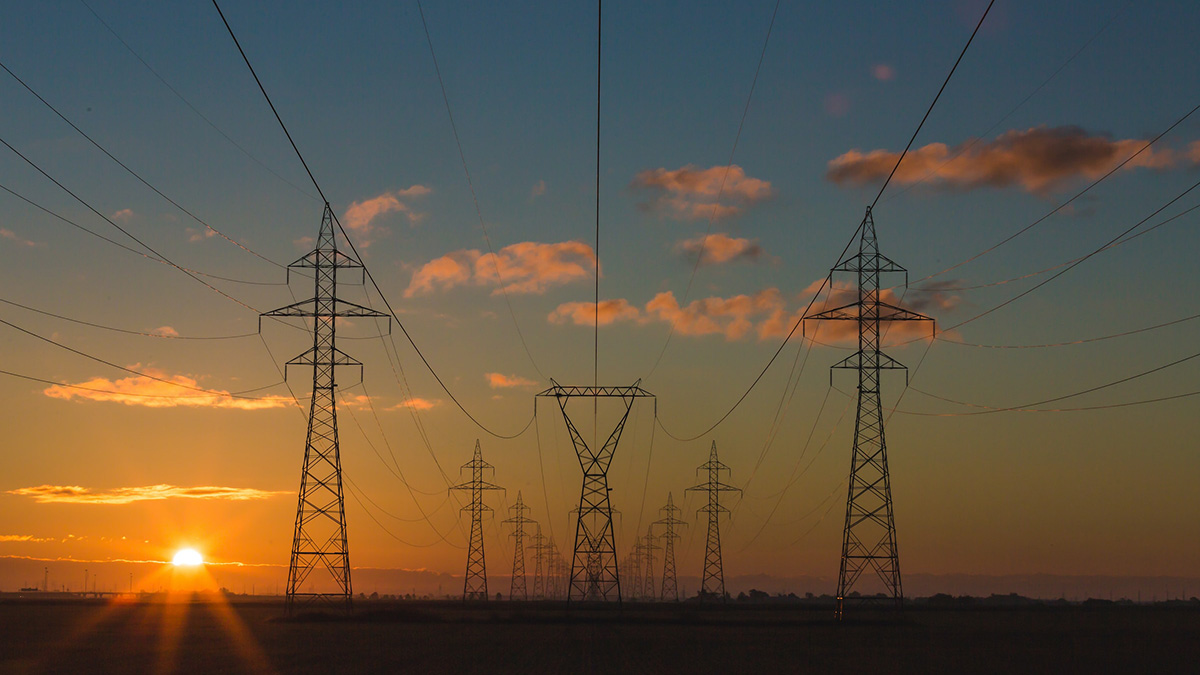
Summer Heat Waves Could Cause Blackouts Across the Country
Higher than normal temps could strain grids that are not used to unprecedented heat waves.