
Laboratory experiments reveal that gravity wave-turbidity current interactions (combined flows) can enhance sediment transport to the deep ocean.
Editors’ Highlights
Posted inEditors' Highlights
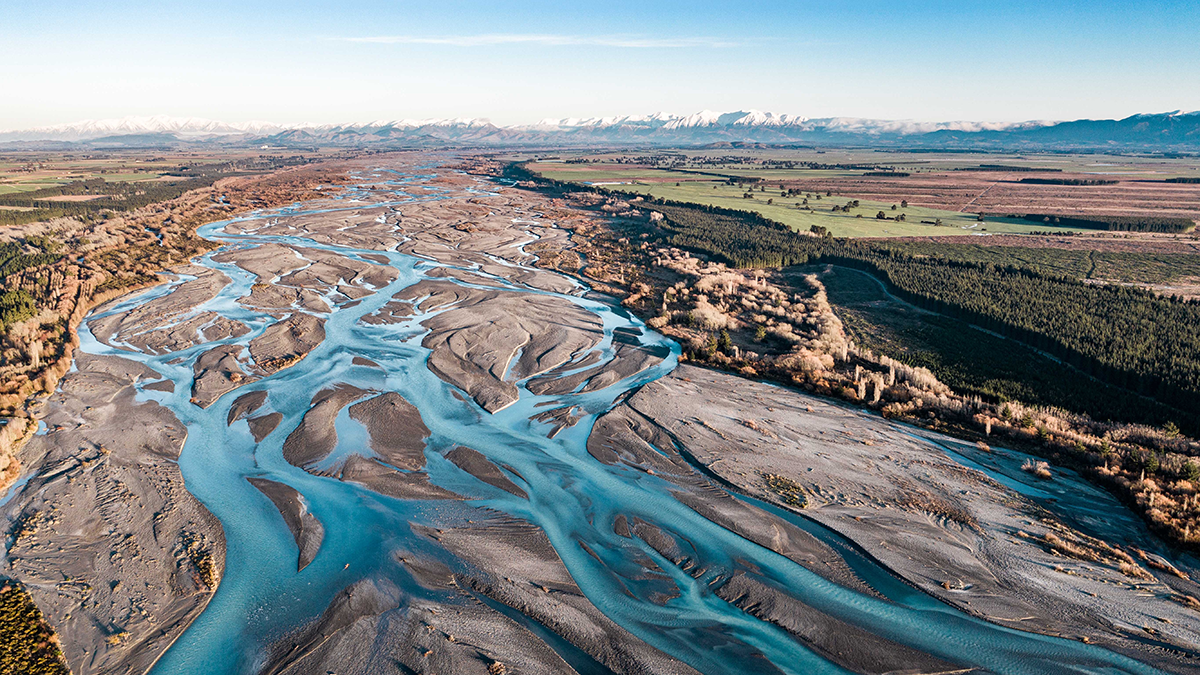
More Braided Rivers from Increasing Flow Variability
Global analysis of satellite data and river flow records show that higher flow intermittency after climate change may lead to an increasing number of threads in braided rivers, thus impacting ecosystems.
Posted inEditors' Highlights
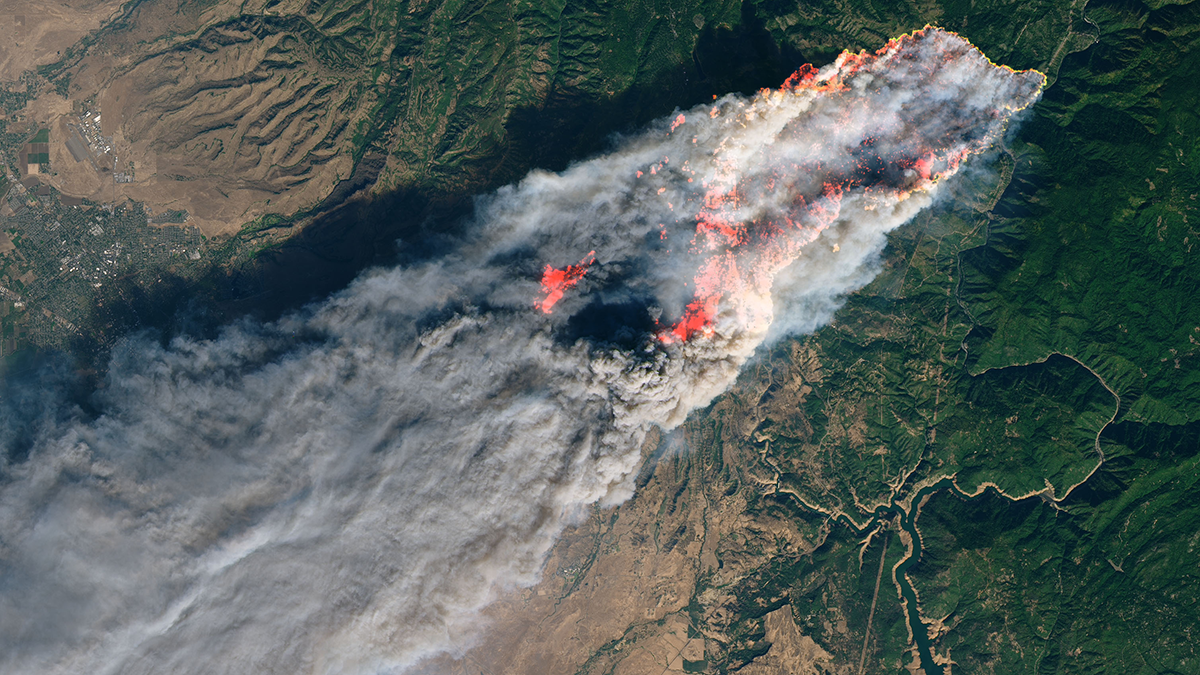
Weather Radar Data Reveal the Dynamics of Rapidly Spreading Wildfires
New research demonstrates the use of operational weather radar measurements to track long-range ember fallout and rapid spread of intense wildfires.
Posted inEditors' Highlights
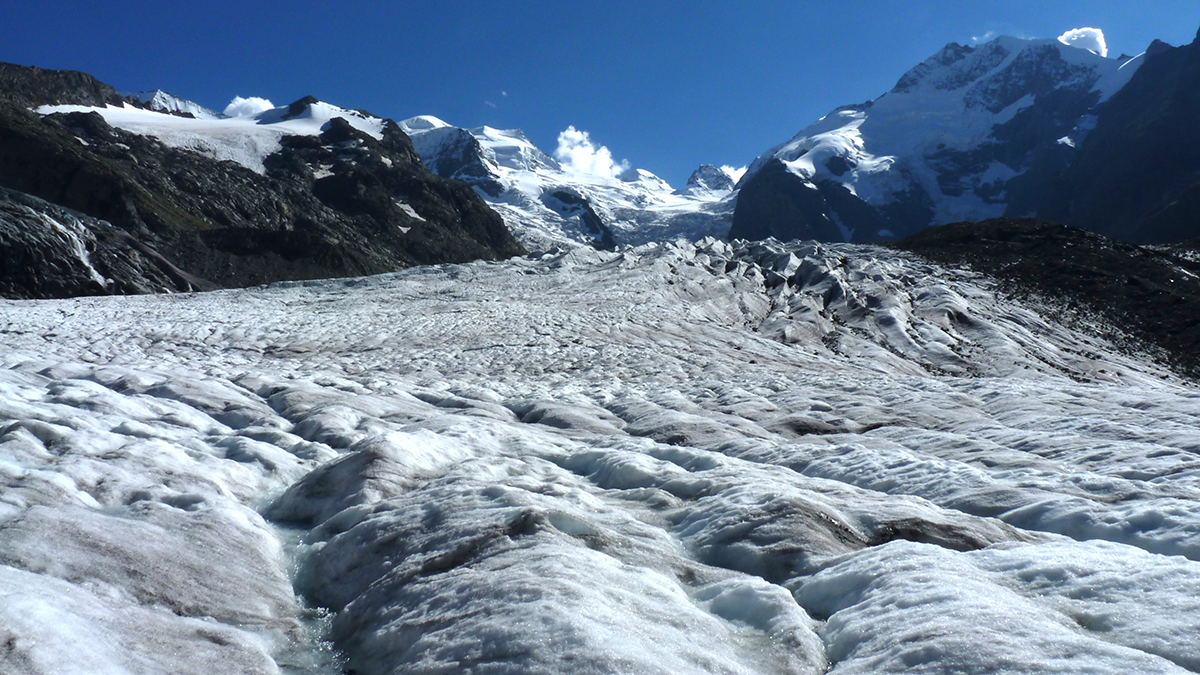
Choice of Glen’s n Leads to Differing Projections of Ice Sheet Mass Loss
Glen’s Law describes the simple physics of ice flow that underpins ice sheet models, but parameter choices substantially influence the outcome of model projections.
Posted inEditors' Highlights
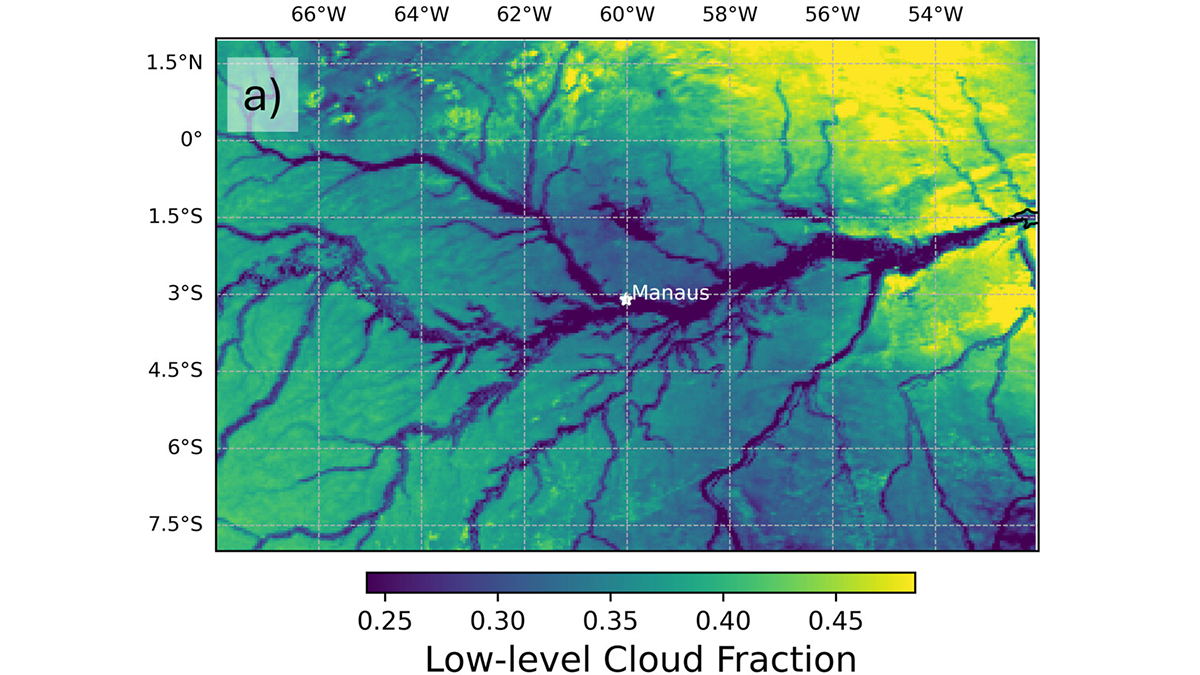
Amazon River Breezes Mimic Pollution in Clouds
Natural river breezes create clouds over the Amazon that mimic the signs of pollution, complicating climate impact assessments.
Posted inEditors' Highlights
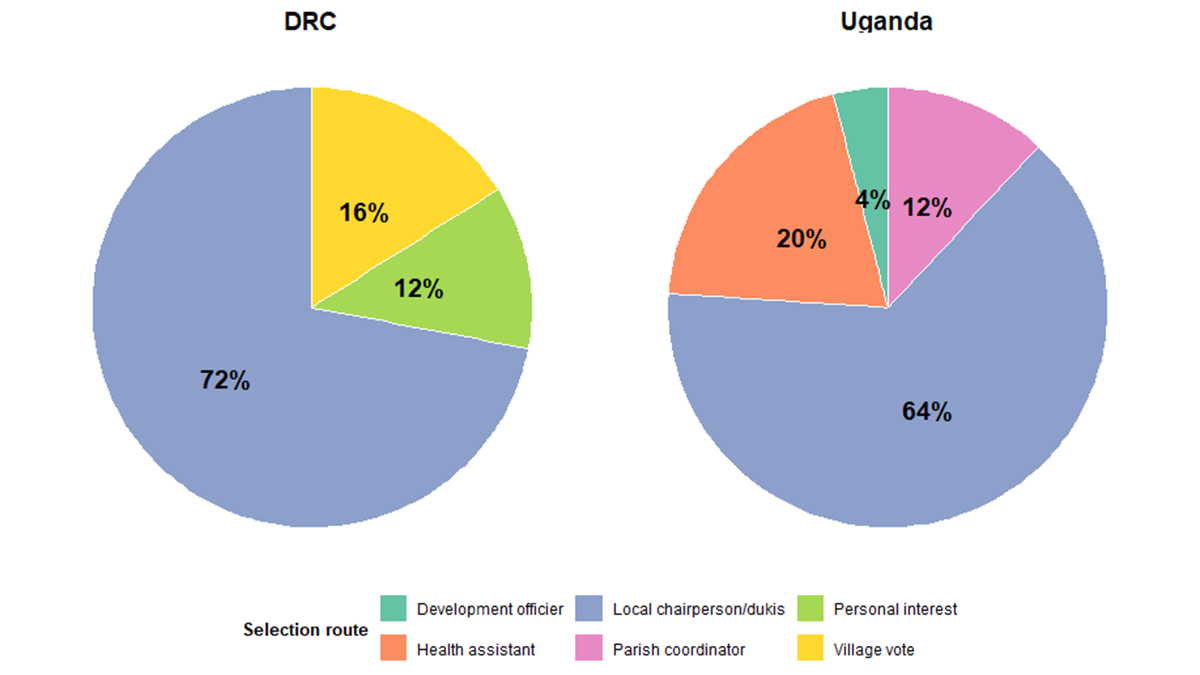
Snail-Borne Diseases in Central Africa: Lessons from Citizen Science
The ATRAP project in the Democratic Republic of Congo and Uganda provides insights to the factors that shape citizen science practice in low- and medium-income countries (LMIC).
Posted inEditors' Highlights
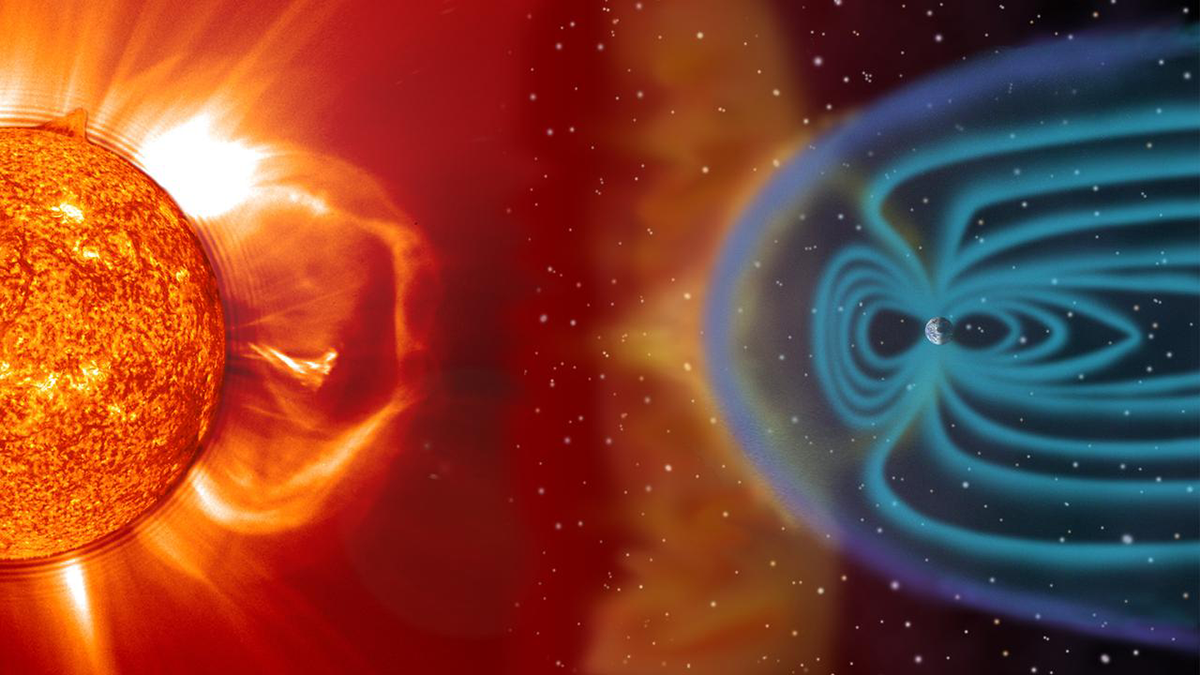
Timing of Geomagnetic Storms Shapes Their Impact
The impact of geomagnetic storms, which can disrupt satellites, GPS, and power grids, is shown to depend on their onset timing.
Posted inEditors' Highlights
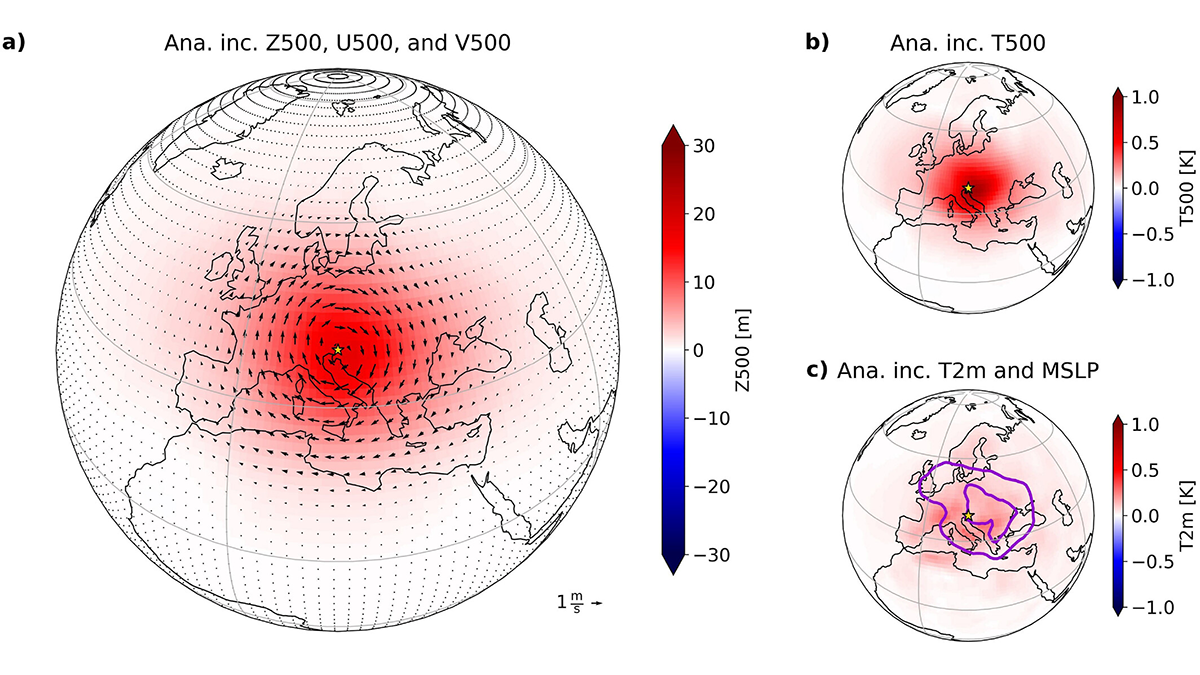
Machine Learning Can Improve the Use of Atmospheric Observations in the Tropics
Scientists develop a novel machine learning-based technique that is equally effective in gaining information from observations about the unobserved state variables in the midlatitudes and tropics.
Posted inEditors' Highlights
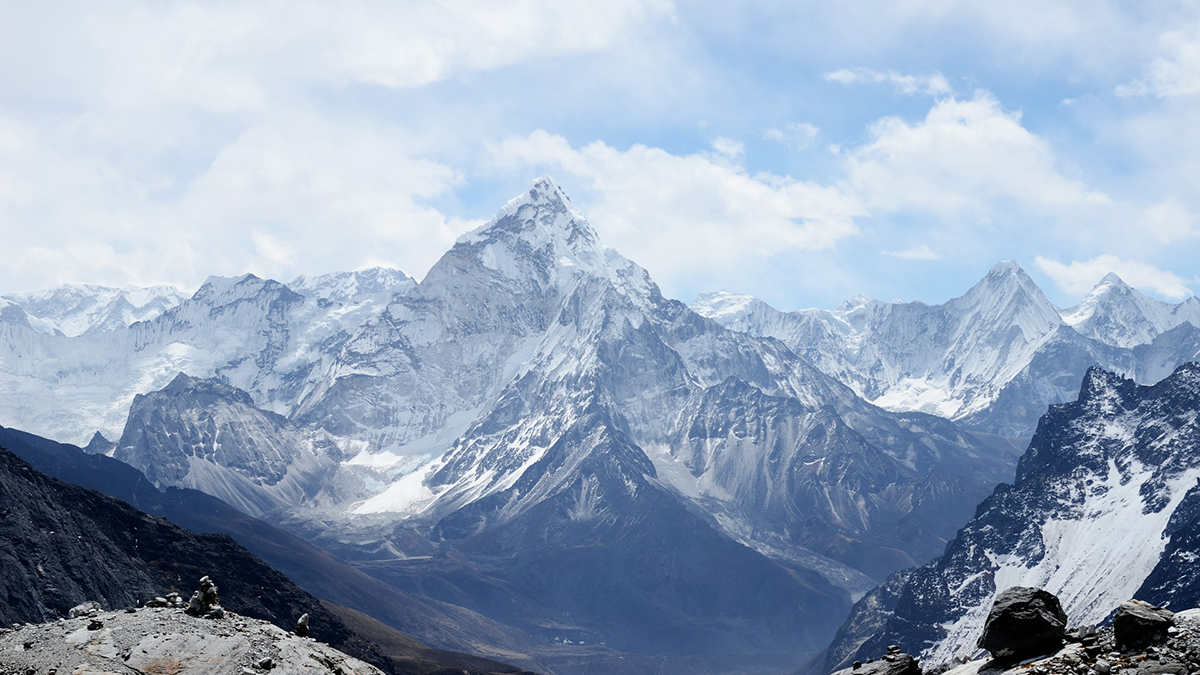
Constructive Debate on the Rise of the Tibetan Plateau
A constructive debate on Himalayan tectonics shows how respectful scientific dialogue helps test competing ideas about how Earth’s highest plateau formed.
Posted inEditors' Highlights
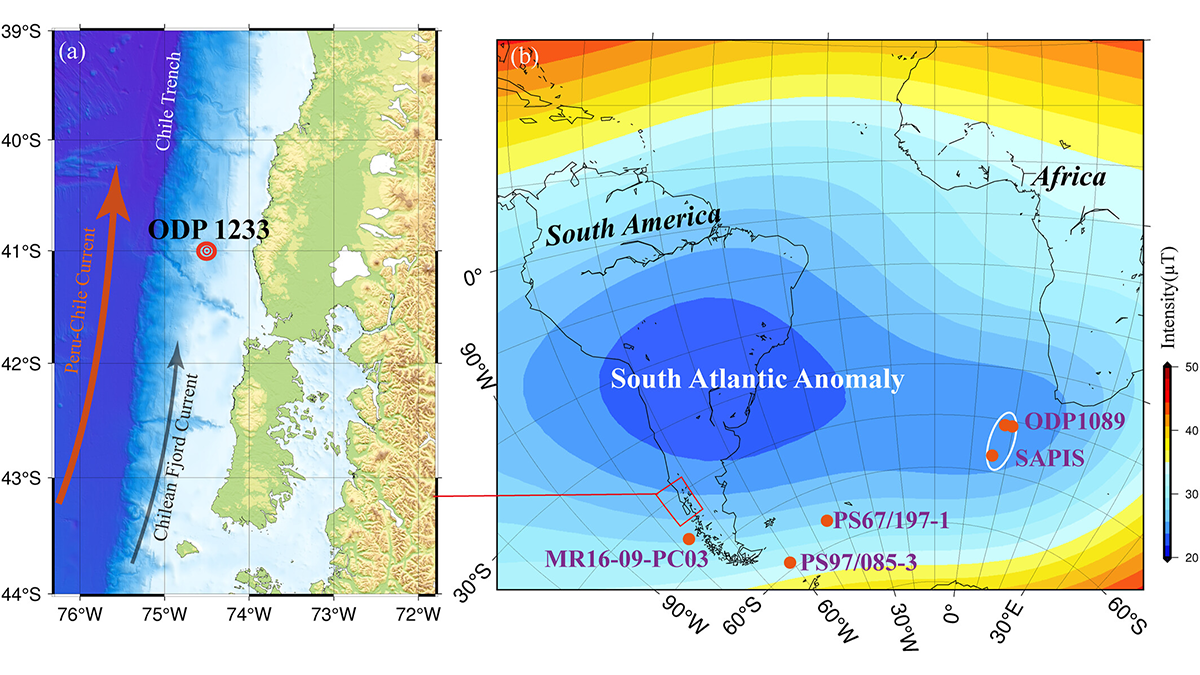
How Sediment Magnetism Captures the South Atlantic Anomaly
Magnetic data from an ODP core deposited during normal secular variation (65-41 thousand years ago) off the Chilean margin help clarify geomagnetic field behavior in the South Atlantic Anomaly region.