One of the largest sources of uncertainty in projections of Earth’s future climate and of the effects of climate change is the cycle of feedbacks between climate and responses of the terrestrial biosphere, particularly Earth’s plant life. These feedbacks can both mediate and contribute to rising levels of carbon dioxide (CO2) in the atmosphere [e.g., Cox et al., 2013], which can result in different types of responses within ecosystems at different timescales.
In June 2018, NASA launched its ECOSTRESS mission, which features an instrument on the International Space Station.
For example, in boreal (northern) forests in North America and Eurasia, warmer temperatures may facilitate better growing conditions and new environmental niches in some cases [Bonan et al., 1995]. Warmer temperatures may also increase the frequency and severity of infestations, to which stressed plants are more vulnerable, and fires, both of which affect dominant tree species [Kurz et al., 2008; Soja et al., 2007; Yurganov et al., 2011]. Tropical and coastal ecosystems, considered highly vulnerable to local- and global-scale stressors, also exhibit complex responses to changing climate conditions. In terrestrial tropical ecosystems, for example, changing conditions have been linked with initial increases in productivity—though these increases may slow over time once CO2 fertilization saturates [Li et al., 2018]—as well as with detrimental effects on biodiversity. In managed ecosystems throughout the world, changes in water availability are causing increased stresses on food security [Brown and Funk, 2008], necessitating the collection and use of high-quality data to improve precision management.
Taking Earth’s Temperature from Space
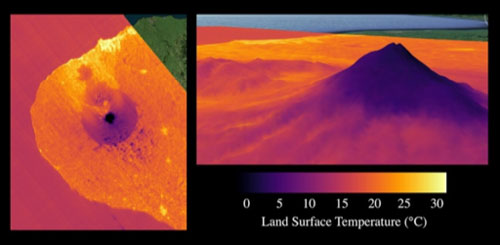
In June 2018, NASA launched its Ecosystem Spaceborne Thermal Radiometer Experiment on Space Station (ECOSTRESS) mission, which features an instrument on the International Space Station (ISS). This instrument collects thermal data from Earth’s surface with the highest combined spatial, temporal, and spectral resolution to date. These data are used to model evapotranspiration (ET), a measure of water transfer from plants and soils to the atmosphere. Rising temperatures and limited water can result in increased vegetation stress, causing plants to closely conserve water. As the release of water has a cooling effect, stressed plants heat up, a change that can be detected as increases in temperature and ET. Evapotranspiration underpins the ECOSTRESS mission’s main science and applications goals to understand (1) how water availability affects key climate biomes around the world, (2) the variability of evapotranspiration on a diurnal (subdaily) scale, and (3) drought onset and agricultural vulnerability.
To achieve these science and applications objectives, ECOSTRESS produces data at 70-meter resolution. The data product suite includes land surface temperature and emissivity, evapotranspiration, water use efficiency, and evaporative stress (NASA Jet Propulsion Laboratory (JPL) data product levels L2, L3, and L4). ECOSTRESS revisits and collects data over a given area as often as multiple times per day or as infrequently as every few days, depending on location. The ISS travels in a tilted (precessing) orbit, so solar illumination at any given location varies with each successive pass, with conditions repeating every 90 days. Thus, ECOSTRESS is able to sample and acquire data from latitudes between 52°N and 52°S at various times through the diurnal cycle.
This holistic approach to training using a real-world example helped demonstrate how ECOSTRESS data can be used to assess drought impacts and vegetation stress.
In February, the ECOSTRESS team convened a 3-day science and applications team meeting with more than 70 attendees in Ventura Beach, Calif. Team members provided updates regarding the mission’s status and early results from the science data. Principal investigators from the ECOSTRESS Science and Applications Team also presented about projects selected as part of a NASA Research Opportunities in Space and Earth Science call.
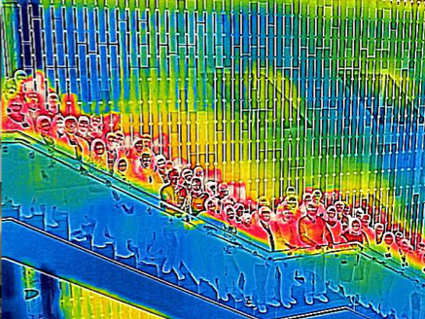
The selected projects span multiple disciplines across studies of terrestrial ecosystems, public health (vector-borne disease and urban heat islands), and geothermal environments, as well as investigations of inland aquatic zones, coastal estuaries, and other coastal systems. One project highlighted the use of ECOSTRESS data to examine urban heat island characteristics at different times of day, with an example in Los Angeles. Another project showed differences in diurnal evapotranspiration patterns depending on land cover type (e.g., agriculture or forests) and detection of thermal pollution from power plants. This meeting also included an update on ECOSTRESS Early Adopters, an initiative from NASA to increase usability and access to mission data. The initiative is using early engagement with the ECOSTRESS team and data sets to cultivate a community of practice.
Yun Yang from the U.S. Department of Agriculture is working with ECOSTRESS data to study agriculture and crop stress. She said, “With the 4-day (or better) revisit time of ECOSTRESS, we’ll be able to significantly improve estimates of our seasonal evapotranspiration in the eastern U.S., whereas Landsat alone often gives us, at best, a couple of clear shots of the Earth during the peak crop growth period.”
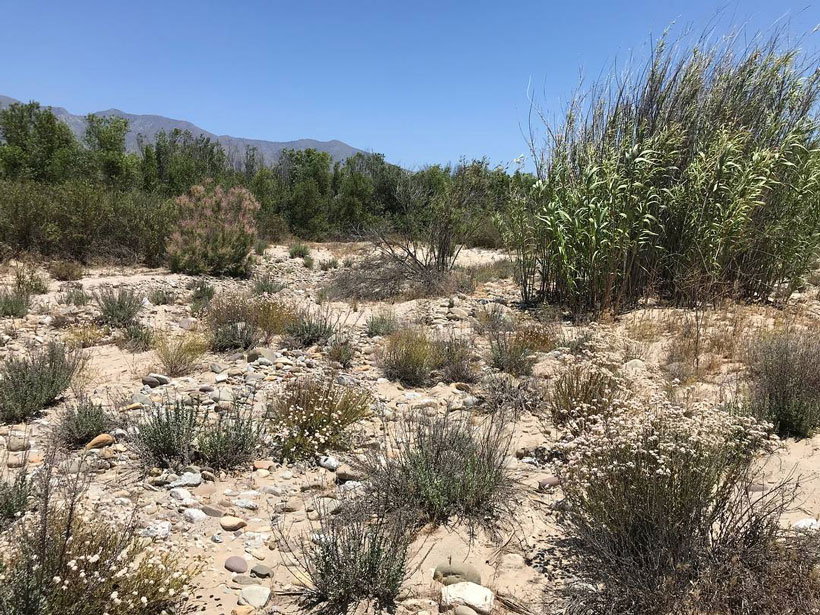
Meeting attendees also participated in a multipart hands-on training on the use of ECOSTRESS data to assess evapotranspiration and land surface temperature in a riverbank (riparian) zone that was affected by the recent drought in California. The training included four components:
- an introduction to the drought extent and its effects on the Santa Clara River
- a demonstration on how to access ECOSTRESS data and convert them into a user-friendly format
- a tutorial on applying a cloud mask to ECOSTRESS surface temperature products using Jupyter Notebook and QGIS geospatial data software, two open-source tools
- a visit to the study areas

This holistic approach to training using a real-world example helped demonstrate how ECOSTRESS data can be used to assess drought impacts and vegetation stress. In the case of the Santa Clara River example, ECOSTRESS’s variable sampling allowed researchers to observe increased water stress in the afternoon relative to morning conditions. The ECOSTRESS team also provided practical tools during the training sessions to help those new to working with ECOSTRESS get started (Figure 1).
New Information Opens New Applications
The recent workshop highlighted the importance of ECOSTRESS data in conducting powerful new science and applications investigations related to terrestrial ecosystems (including effects of wildfire), coastal and inland aquatic ecosystems, geology, and public health. These investigations rely on high spatiotemporal resolution, diurnal sampling, and high-quality data products. Further, the community of researchers working with ECOSTRESS data is collaboratively advancing science and applications, enabled in part by various hands-on tutorials and workflow scripts developed and freely shared by community members.
The community has also reflected on ECOSTRESS within the broader context of the thermal program of record (i.e., the continuity of remote sensing collections of high-resolution thermal data, dating back to 1999, from various Earth science missions) as well as future Earth science missions from the United States and Europe. Early and recently selected ECOSTRESS projects clearly demonstrate how multispectral thermal infrared (TIR) data are needed to address critical decadal survey priorities, in particular those priorities focusing on land surface temperature and evapotranspiration.
A representative from the Surface Biology and Geology (SBG) mission concept team, Charles Miller, discussed the status of the SBG Architecture Study. This study will deliver a suite of observing architecture options to NASA that can be used to address decadal survey priorities using an imaging spectrometer (visible to shortwave infrared) and multispectral thermal measurements set. Miller underscored the importance of the latter, stating that “the Surface Biology and Geology mission will benefit tremendously from ECOSTRESS advances in thermal infrared imaging and [our team] will extend high-resolution TIR imaging.”
ECOSTRESS continues to provide insights into critical thresholds in water use efficiency and different vegetation types that exhibit unique patterns in diurnal evapotranspiration.
ECOSTRESS, now in its second year aboard the ISS, continues to acquire critical thermal data sets. These data sets are being used to provide insights into the key mission science questions, including revealing critical thresholds in water use efficiency among the climate transition hot spots as well as different vegetation types that exhibit unique patterns in diurnal evapotranspiration.
As the high-resolution data record expands, managing the resulting large-volume data sets presents a key challenge for ECOSTRESS and future Earth-observing missions. Close collaborations between mission teams and data archive centers will result in the codevelopment of new tools and services to support users in accessing and analyzing data more readily. These collaborations and tools will facilitate ECOSTRESS’s contribution to continuity in the thermal program of record as well as to further reducing uncertainty about how Earth’s biosphere and climate interact now and into the future.
Acknowledgments
The effort was carried out by the Jet Propulsion Laboratory, California Institute of Technology, under a contract with NASA (80NM0018D0004). Government sponsorship is acknowledged. We thank Dar Roberts from the University of California, Santa Barbara; Cole Krehbiel from the U.S. Geological Survey Land Processes Distributed Active Archive Center; Gregory Halverson of the Jet Propulsion Laboratory; and Peter Dixon of The Nature Conservancy, who led the training sessions on the use of ECOSTRESS data.
References
Bonan, G., et al. (1995), Boreal forest and tundra ecosystems as components of the climate system, Clim. Change, 29(2), 145–167, https://doi.org/10.1007/BF01094014.
Brown, M. E., and C. C. Funk (2008), Food security under climate change, Science, 319(5863), 580–581, https://doi.org/10.1126/science.1154102.
Cox, P. M., et al. (2013), Sensitivity of tropical carbon to climate change constrained by carbon dioxide variability, Nature, 494(7437), 341–344, https://doi.org/10.1038/nature11882.
Kurz, W. A., et al. (2008), Mountain pine beetle and forest carbon feedback to climate change, Nature, 452(7190), 987–990, https://doi.org/10.1038/nature06777.
Li, D., et al. (2018), Vulnerability of the global terrestrial ecosystems to climate change, Global Change Biol., 24(9), 4,095–4,106, https://doi.org/10.1111/gcb.14327.
Soja, A. J., et al. (2007), Climate-induced boreal forest change: Predictions versus current observations, Global Planet. Change, 56(3–4), 274–296, https://doi.org/10.1016/j.gloplacha.2006.07.028.
Yurganov, L. N., et al. (2011), Satellite- and ground-based CO total column observations over 2010 Russian fires: Accuracy of top-down estimates based on thermal IR satellite data, Atmos. Chem. Phys., 11(15), 7,925–7,942, https://doi.org/10.5194/acp-11-7925-2011.
Author Information
Christine M. Lee ([email protected]), Joshua B. Fisher, and Simon J. Hook, NASA Jet Propulsion Laboratory, California Institute of Technology, Pasadena
Citation:
Lee, C. M.,Fisher, J. B., and Hook, S. J. (2020), Mapping vegetation health around the world, Eos, 101, https://doi.org/10.1029/2020EO146736. Published on 08 July 2020.
Text © 2020. The authors. CC BY-NC-ND 3.0
Except where otherwise noted, images are subject to copyright. Any reuse without express permission from the copyright owner is prohibited.