Outlet glaciers, tongue-like protrusions that flow from the main body of a glacier, provide the most sensitive indication of changes occurring on the Greenland ice sheet. They exhibit a complex interplay among changes over space and time that are not yet fully understood. Many of Greenland’s outlet glaciers are retreating substantially; they are flowing more rapidly and their surfaces are lowering.
This portal harnesses more than 37,000 images from Landsat archives, dating back to the early 1970s, to track changes in outlet glaciers over time.
Understanding the underlying driving processes requires a system that monitors an entire area on a continuous basis. Our research group has developed a new data portal that provides such an opportunity.
This portal harnesses more than 37,000 images from Landsat archives, dating back to the early 1970s, to track changes in outlet glaciers over time. Through analyzing data from this portal, we can see in great detail how several outlet glaciers are speeding up their treks to the sea. What’s more, any user can access the data to conduct their own studies of glacier behavior at Greenland’s coasts through time.
Lengthening Ice Records with Landsat
Over the years, scientists have used several satellite-based techniques to monitor the Greenland ice sheet and its outlet glaciers. Satellite altimetry has provided observations of ice surface heights and height changes since the 1990s. ICESat provided higher-resolution data from 2003 to 2009, and CryoSat-2 has continued this effort since 2010.
Satellites that were used for satellite radar altimetry also enabled researchers to infer ice flow velocities using synthetic aperture radar interferometry (InSAR) and speckle tracking. Of course, data sets from these techniques are confined to the time span during which a given satellite is collecting data.
Performing some of the necessary analysis steps has only recently become possible.
Examining the Landsat archive, dating back to the first acquisitions of Landsat 1 in 1972, is one promising means of covering a longer time span. However, to exploit this wealth of information, scientists need a processing strategy that ensures consistent results.
We provide that strategy. Performing some of the necessary analysis steps has only recently become possible, with the availability of improved digital elevation models and progress in computer performance and software technology. Our new interface specifically uses Landsat to track flow velocity fields of Greenland’s outlet glaciers and how they have changed over time.
Thousands of Landsat Scenes Make a Greenland Database
Researchers can access our new web-based data portal to thoroughly explore how glacier flow velocities along the margin of the Greenland ice sheet has evolved over time. Researchers can also examine seasonal variations in the flow velocity for most of Greenland’s outlet glaciers, a significant new capability.
We based our project on more than 37,000 optical images collected by multiple sensors aboard the U.S. Geological Survey (USGS) and NASA’s Landsat satellites. The data span the period between 1972, when Landsat 1 was launched, and 2015, using data from Landsat 8 (launched in 2013), although most of the Landsat scenes were acquired after 1998.
We will continue to extend the database using new scenes recorded by the ongoing Landsat 7 and 8 missions. The USGS Landsat Global Archive Consolidation (LGAC) will add even more scenes, providing access to Landsat data that are archived at individual international ground stations [Wulder et al., 2016]. For Greenland, this could provide a considerable number of scenes from Landsat 4 and 5, dating back to 1982.
These additional images are valuable for extending the time span of the velocity time series. This greater time span is particularly important for inferring flow velocity variations that occur within the span of one season, and it may help to close observation gaps that occurred before 1999, when Landsat 7 was launched. Moreover, in regions of extensive cloud coverage, collecting Landsat scenes over a longer time span increases the chance of obtaining cloud-free data.
Enhanced Data Processing Provides a Clearer Picture
For 302 glaciers all around Greenland, we have processed more than 100,000 flow velocity fields from 1972 to 2012. We have extended this processing to include velocity fields for about 50 major glaciers up to 2015 so far.
By adding a quality flag that indicates the reliability of the data, we reduced the number of existing velocity fields with extensive outliers. We used an outlier detection strategy that compared the differences between each observed velocity product and a theoretically derived velocity field to compile the statistical parameters for our evaluation. Altogether, we have made more than 40,000 flow velocity fields accessible so far, and we continue to add new velocity fields as we process more data.
Rosenau et al. [2015] described a number of steps included in the processing procedure. We have improved the correction for tilt and terrain effects (orthorectification) using the Global Digital Elevation Map Version 2 (GDEM V2) from NASA’s Advanced Spaceborne Thermal Emission and Reflection Radiometer (ASTER). The improved orthorectification step, in particular, facilitates the usage of overlapping scenes from orbits that are not repeat passes. The ability to include these additional scenes provides a much higher effective sampling rate than would be provided by repeat-pass sampling, which is limited to the repeat orbit of 16 days (Landsat 4 to 8) or 18 days (Landsat 1 to 3).
In 2003, a small pair of mirrors (the scan line corrector) aboard Landsat 7 failed, introducing data gaps as well as small shifts between the scan lines. We applied a destriping correction to mitigate the impact on the resulting velocity fields. In addition, we removed outliers using an adaptive, recursive filter approach. The combination of all these improvements leads to higher accuracy of the inferred velocity fields.
Long-Term and Seasonal Trends in Flow Velocity
The long time span covered by the Landsat scenes allows us to determine long-term flow velocity trends. The high temporal resolution lets us analyze seasonal flow velocity variations of numerous outlet glaciers. However, the pattern of temporal and spatial distributions of the flow velocity changes is not uniform (Figure 1). The monitoring system provides a powerful tool to examine the flow velocity pattern throughout time and space, and we have detected an acceleration pattern for a number of outlet glaciers.

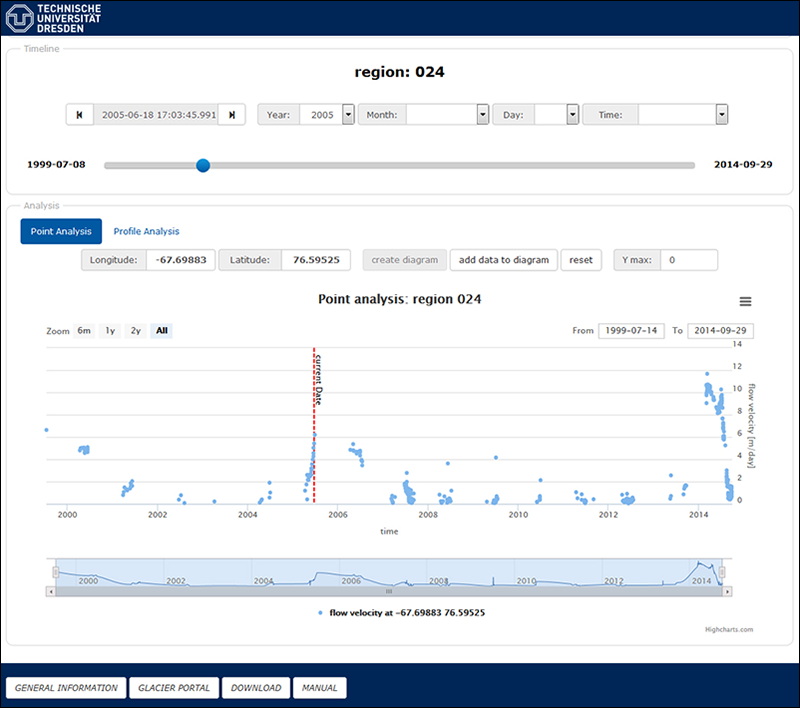
These findings are consistent with most previously published results [e.g., Moon et al., 2014], and rapid changes can now be analyzed in detail. For example, in addition to the known 2005 surge of Harald Moltke Bræ (an outlet glacier in northwestern Greenland), we found further periods of similarly high flow velocities during 1999–2000 (Figure 2).


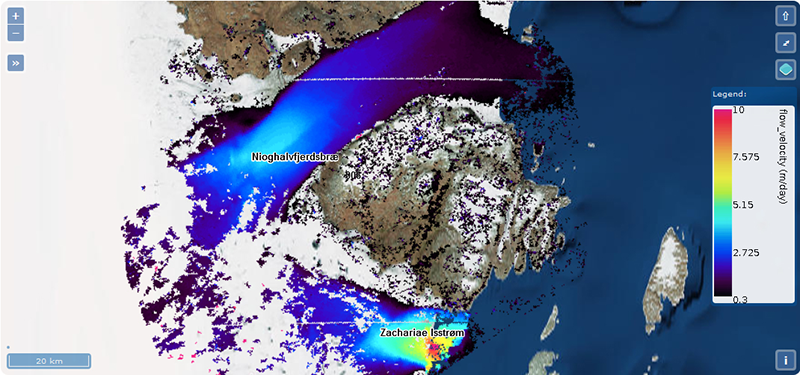
The nonuniform, high variability of the flow velocity pattern along the margin of the Greenland ice sheet is especially evident in northeastern Greenland (Figure 3). For example, analysis of data spanning the past decade revealed no significant change in the flow velocity for the outlet glacier Nioghalvfjerdsbræ close to the grounding line.

In contrast, Zachariae Isstrøm, its neighbor to the south, features a flow velocity acceleration of 43%. This acceleration is correlated with the breakup of the glacier’s floating part that formerly formed an ice shelf between Lambert Land, that divides Zachariae Isstrøm from Nioghalvfjerdsbræ, and the off-coast island of Schnauder Ø. Rosenau et al. [2015] have discussed the resulting flow velocity fields and their changes in greater detail.
Web Portal Lets Scientists Apply the Data

We built the new data portal as a publicly accessible web interface to the database, which was accomplished in close cooperation with our colleagues of Technische Universität Dresden’s Professorship of Geoinformatics. The portal facilitates web-based calculations to derive information such as flow velocities along profiles or time series for a glacier location that can be interactively selected on the map. The portal offers various data download options. For the time being, the data portal is focused on the specific project for the Greenland outlet glaciers. However, the techniques and methods used in the data portal offer great flexibility and general usability.
The data are stored in the well-established Network Common Data Form (NetCDF) format. For handling and processing the huge number of Landsat scenes, we created a relational database using PostgreSQL. Thematic Real-time Environmental Distributed Data Services (THREDDS) provides an interface between data, metadata, scientific calculations, and map services. The Web Map Service (WMS), which is integrated into THREDDS, displays the results.
This interface also allows users to apply specific analysis tools. The point analysis, for example, incorporates the standardized function “GetFeatureInfo.” With such built-in techniques, THREDDS lets us retrieve the velocity at a given point for all velocity fields within one NetCDF file, yielding a time series at the specific location (Figure 2).
These calculations are performed on demand; that is, any calculation is made at the time the user requests it. The host server completes all calculations and interface processes in the background, and the resulting maps and graphics are then displayed on the user’s screen.
We also incorporated a submenu “manual” that provides assistance on how to handle the data portal and the analysis tools it offers. Given this flexibility, the web-based techniques could be applied to include other sensors and to extend the processing to other regions featuring similar ice flow behavior, the margin of the Antarctic ice sheet, for example.
A New View of Greenland’s Glaciers
State-of-the-art web-based techniques enable us to provide the scientific user with a powerful data portal to explore the temporal evolution of the glacier flow velocity of more than 300 Greenland outlet glaciers. The portal allows users to rapidly determine seasonal variations of the flow velocity—calculations that only data from this portal can accomplish.
The portal allows users to rapidly determine seasonal variations of the flow velocity—calculations that only data from this portal can accomplish.
USGS is distributing newly acquired Landsat scenes in near-real time, which enables us to process these scenes immediately and rapidly integrate the inferred flow velocity products into the web portal. This will allow researchers to quickly access and analyze the velocity information, especially in regions where the dynamics of the outlet glaciers change rapidly.
The ability to analyze changes in glaciers as they are happening, coupled with the context provided by decades of satellite data, provides scientists with an unprecedented ability to gain understanding of the processes that drive the rapid changes in high-latitude glaciers. With this information, they can better evaluate the consequences of those changes.
References
Moon, T., et al. (2014), Distinct patterns of seasonal Greenland glacier velocity, Geophys. Res. Lett., 41(20), 7209–7216, doi:10.1002/2014GL061836.
Rosenau, R., M. Scheinert, and R. Dietrich (2015), A processing system to monitor Greenland outlet glacier velocity variations at decadal and seasonal time scales utilizing the Landsat imagery, Remote Sens. Environ., 169, 1–19, doi:10.1016/j.rse.2015.07.012.
Wulder, M. A., et al. (2016), The global Landsat archive: Status, consolidation, and direction, Remote Sens. Environ., 185, 271–283, doi:10.1016/j.rse.2015.11.032.
Author Information
Mirko Scheinert (email: [email protected]), Ralf Rosenau, and Benjamin Ebermann, Institut für Planetare Geodäsie, Technische Universität Dresden, Dresden, Germany
Citation:
Scheinert, M.,Rosenau, R., and Ebermann, B. (2016), Using landsat to take the long view on Greenland’s glaciers, Eos, 97, https://doi.org/10.1029/2016EO065625. Published on 29 December 2016.
Text © 2016. The authors. CC BY-NC-ND 3.0
Except where otherwise noted, images are subject to copyright. Any reuse without express permission from the copyright owner is prohibited.

