If you are a jazz fan, you may be familiar with Ella Fitzgerald singing ‘How deep is the ocean, how high is the sky’. Using data from the Shuttle Radar Topography Mission we now know how high the land really is.
mapping
Posted inResearch Spotlights
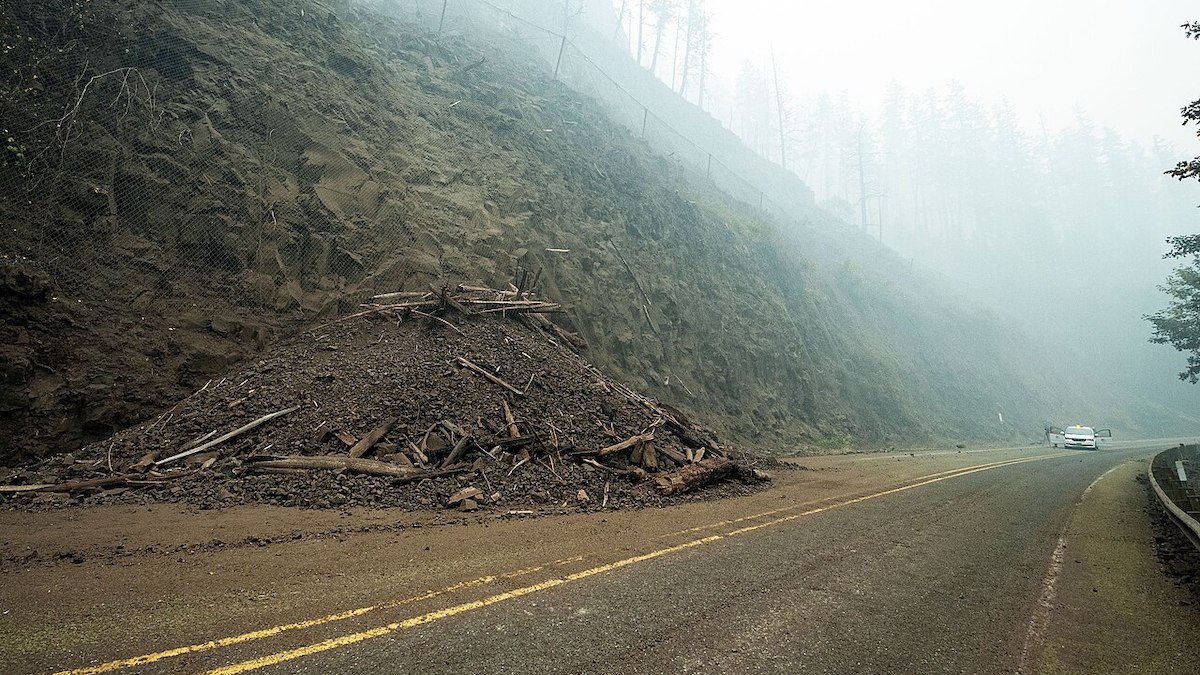
Mapping Landslide Risk in the United States and Puerto Rico
A new method provides highly accurate continental-scale landslide susceptibility maps that are being used in the aftermath of Hurricane Helene.
Posted inNews
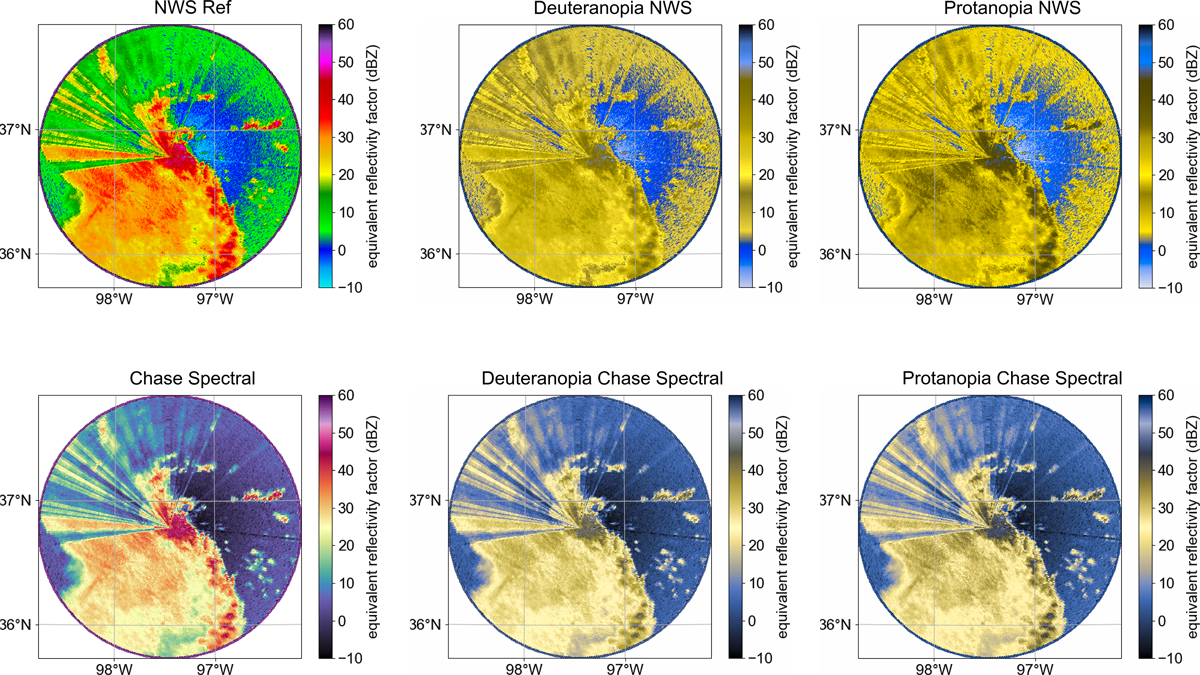
Putting Accessibility on the Map
New research demonstrates how to make radar maps more easily interpretable for people with color vision deficiency.
Posted inNews
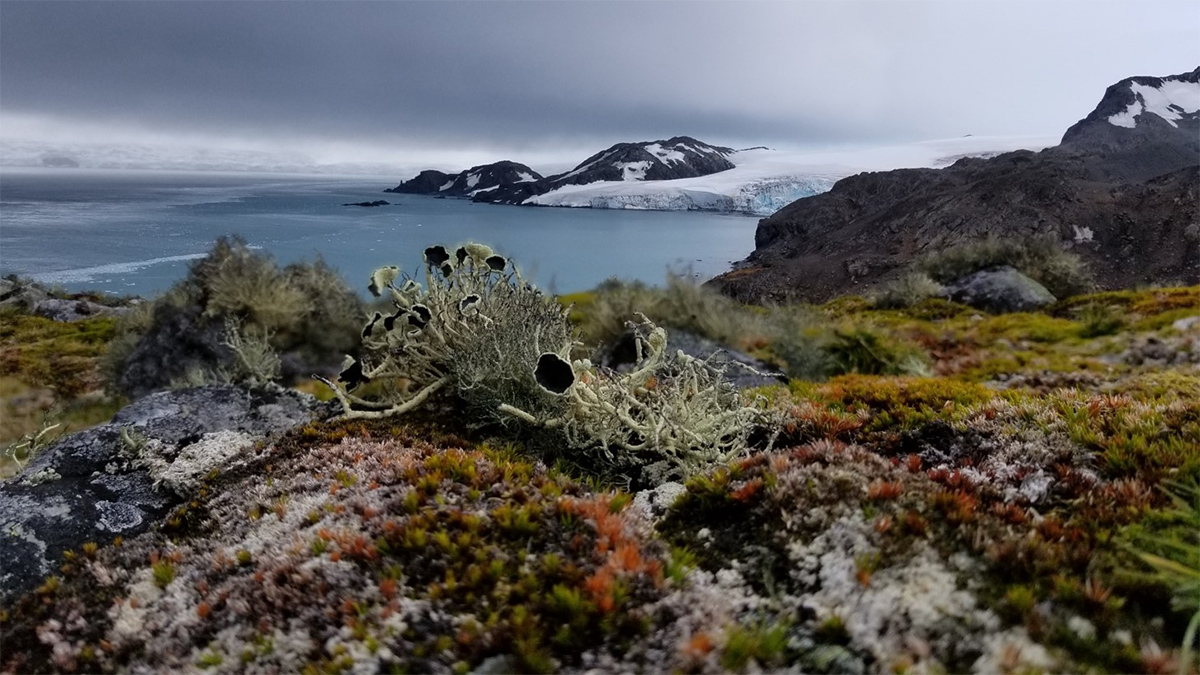
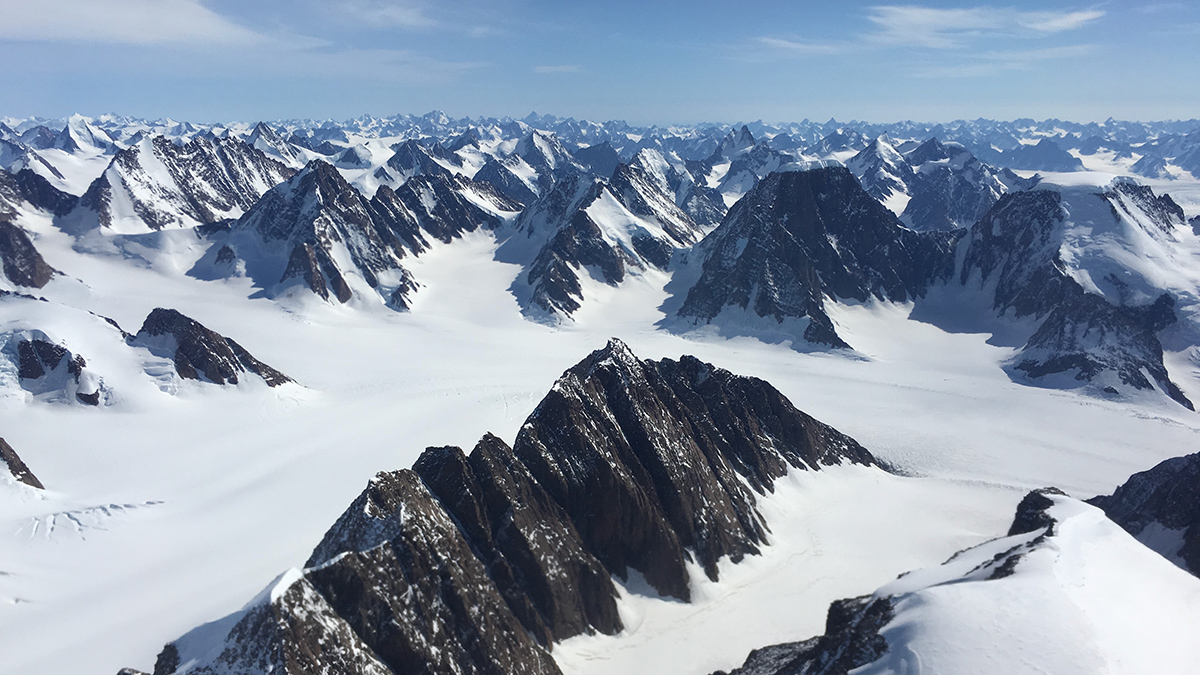
New Map Reveals the Extent of Vegetation in Antarctica
More than 40 square kilometers of vegetation cover Antarctica, including in previously unknown areas. A new map offers fresh insights for conservation amid climate change.

Posted inFeatures
Sensing Remote Realms of the Deep Ocean on Earth—and Beyond
A novel laser-equipped probe is collecting measurements of deep-sea geochemical environments that once seemed impossible to gather, pointing the way toward future explorations of other ocean worlds.


Posted inNews
Sedimentary Basins Tell Zealandia’s Ancient Story
New interpretations and mapping of all New Zealand’s offshore sedimentary basins offer clues about the evolution of Earth’s eighth continent.

Posted inNews
Finally, Hawaii Gets Its Own Climate Divisions
Researchers have analyzed precipitation patterns in the 50th state to define a long-overdue data set that brings Hawaii into the fold of modern-day climate analyses.

Posted inResearch Spotlights
Seals Help Scientists Make Discoveries in Antarctica’s Bellingshausen Sea
By analyzing hydrographic information gathered by seals and an undersea glider, researchers found new meltwater currents, as well as a new seafloor trough.
Posted inResearch Spotlights
Beneath the Ice: Greenland’s Geology Revealed in New Map
Advances in remote sensing offered an opportunity to redraw Greenland’s geologic map for the first time in 15 years.