Subduction zones are complex. But mapping them is now as simple as cropping a family photo.
That’s thanks to Submap, an online resource hosted by the University of Montpellier in France. The latest version was intentionally designed for a wide audience, suitable for students, teachers, and professional researchers. The fast, free service incorporates dozens of data sets and makes mapping available to anyone with an Internet connection.
“Everything is public. Everybody can use it,” said Serge Lallemand, a marine geodynamicist who helped develop the resource.
Graphic Design Meets Geoscience
Some of the deadliest disasters in recent history have occurred around subduction zones, including the 2004 Indian Ocean tsunami and the 2011 Tōhoku earthquake. But scientists are still distinguishing the phenomena that cause these catastrophes. The slow scrape of subducting plates occurs deep underground. Visualization tools like Submap can illuminate the process by creating maps and cross sections from multiple areas and angles.
The first version of Submap appeared online in 2009. In the years since, Lallemand and his research group have steadily published public data sets to improve the project. This spring, they went a step further and completely overhauled the website to make it more widely accessible. The new version debuted in June.
Submap has always been a public resource, said Lallemand. His lab group regularly adds and updates their findings and boosts the site with public data sets published by others. The modules include parameters that factor into the formation of giant tremors, like sediment thickness and seafloor roughness.
The user-friendly design was intentional, too, he said. The Submap team includes geoscientists and computer engineers but also a graphic designer. Although other mapping tools exist, Submap is unique in its user-friendly appearance, Lallemand said. The tools also include options for readers who are color-vision deficient, following inclusive recommendations from a 2020 Nature Communications perspective.
How to Map a Subduction Zone
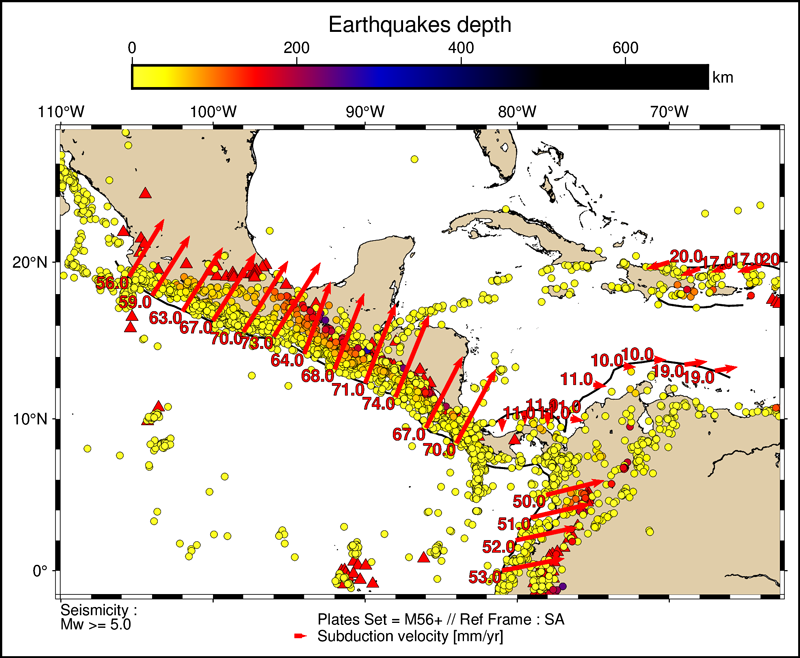
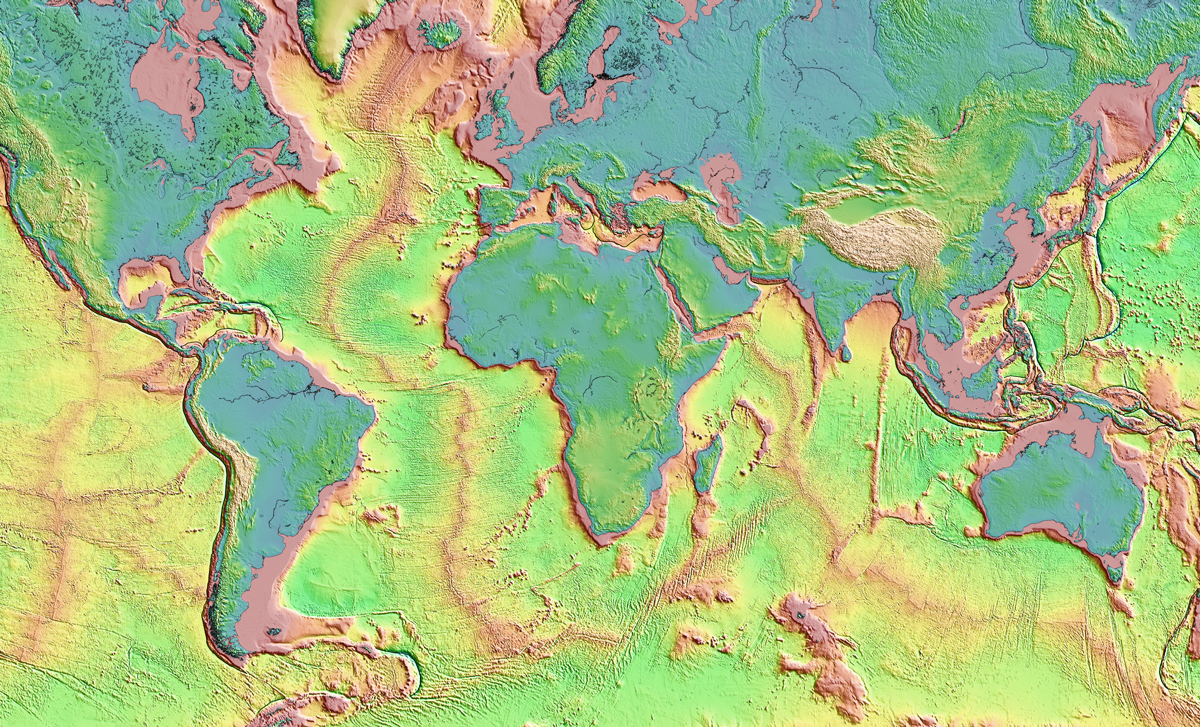
The Submap website features four tools, including MAP-Geodyn. The mapping service lets users simply drag and drop the corners of a square over a map of the world just like they’re cropping a photo. Users decide what parameters to visualize, like seafloor age or topobathymetry. They can pepper their map with volcano locations, earthquake epicenters, and subduction velocities. Users click “generate map,” and seconds later, Submap produces a custom graphic ready to download in multiple file formats.

The other three Submap tools are equally visual. SECTION-Geodyn creates cross sections of Earth’s crust up to 1,800 kilometers long. MAP-Subquake maps seafloor roughness against sites of major subduction earthquakes. Sub-DATA supplies parameters for trench transects around the world.
“It’s very, very thoughtfully designed,” said Margarete Jadamec, a geodynamicist at the University at Buffalo not involved in the project. The tools combine user-friendly layout with actual quantitative data, she said, which meets the needs of several audiences. The program is a valuable teaching tool for students, a vital time-saver for researchers, and an important avenue for science communication.
“Submap is done in such an intuitive way that it has the ability to reach beyond just the scientific community and to really reach the broader public.”
“Submap is done in such an intuitive way that it has the ability to reach beyond just the scientific community and to really reach the broader public,” she said.
Although the Submap site is active and ready to use, Lallemand and his colleagues continue to add to and enhance the data. He’s currently researching kinematic parameters for areas with multiple microplates. His students are examining variations among arc volcanoes. Any results will be published open-access and added to the project.
For now, Lallemand wants researchers to try the tools, get ideas, and deliver feedback. Comments are welcome, he said. Every suggestion and contribution improves the project and increases the public understanding of these potentially catastrophic rupture sites.
—J. Besl (@J_Besl), Science Writer