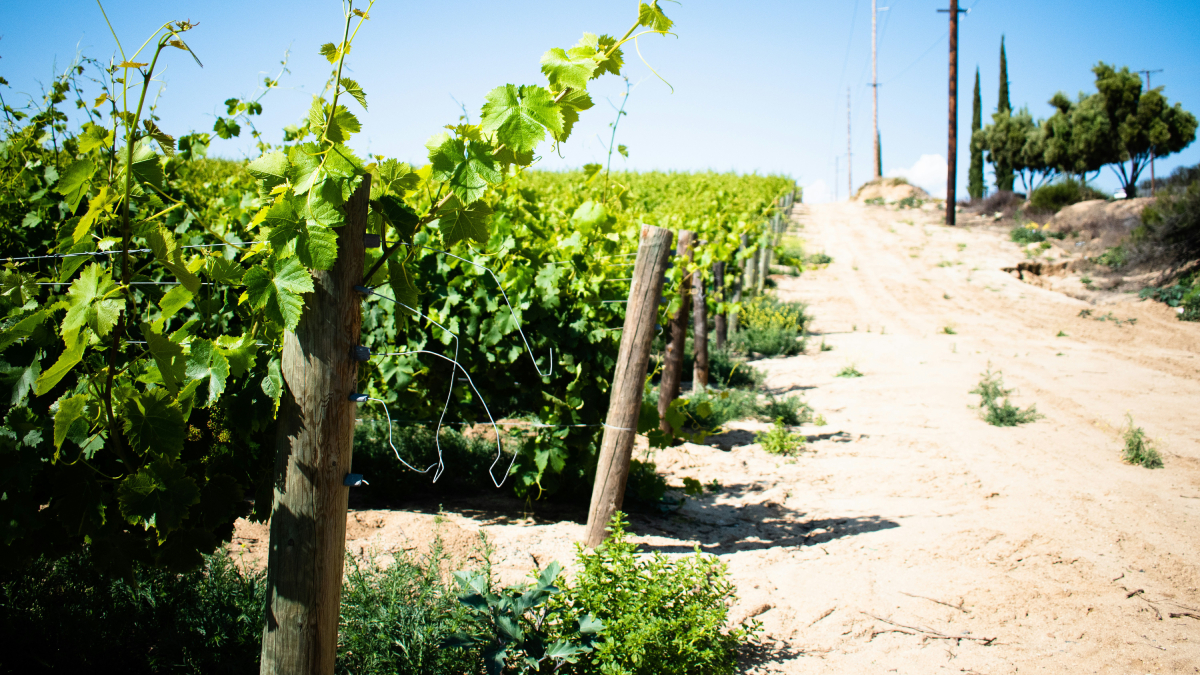
In regions where natural resources are scarce or economies depend on producing certain wines, adapting and diversifying grape crops is easier said than done.
mapping
Posted inNews
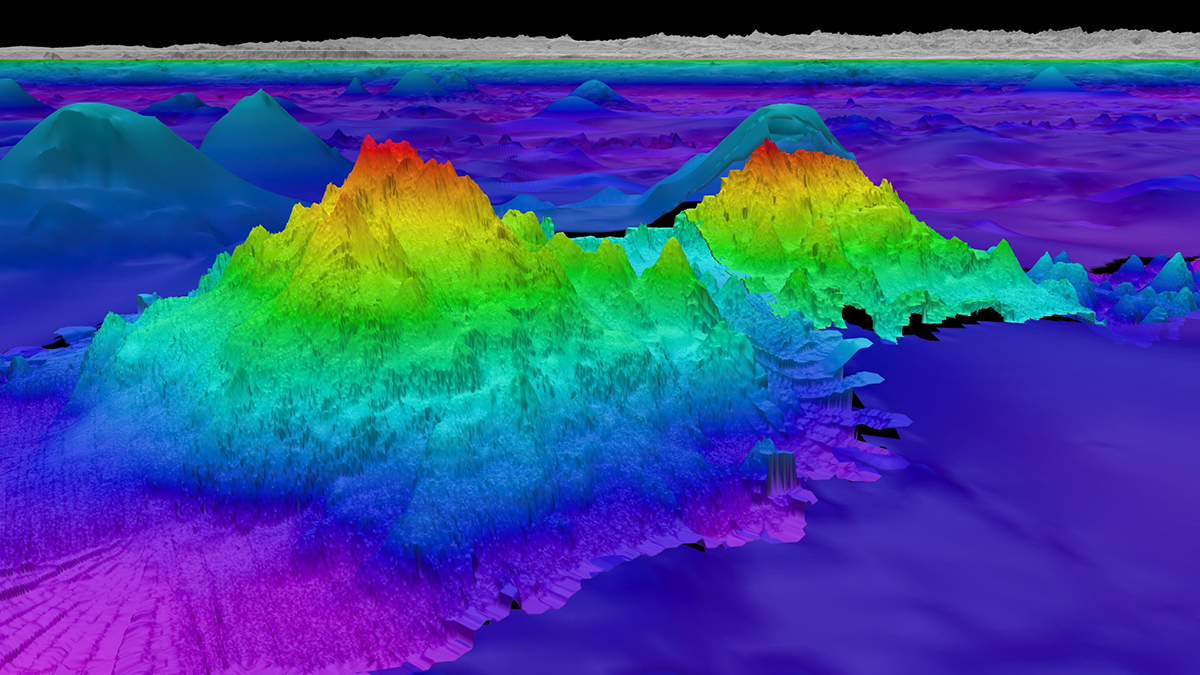
New Seafloor Map Only 25% Done, with 6 Years to Go
Beneath the waves, the vast majority of the ocean is unknown. Seabed 2030 is using cutting-edge technologies to fill in the bathymetric blanks and fully map the seafloor.

Posted inNews
American Samoa’s Sinking Land Speeds Up Sea Level Rise
A new interactive tool is helping residents understand how their lands and homes are at risk.

Posted inNews
Mapping the Ocean’s Motion Energy
The ocean is a central component of Earth’s climate system. But it is in perpetual motion, and understanding the transfer of kinetic energy is key to better ocean models.
Posted inNews
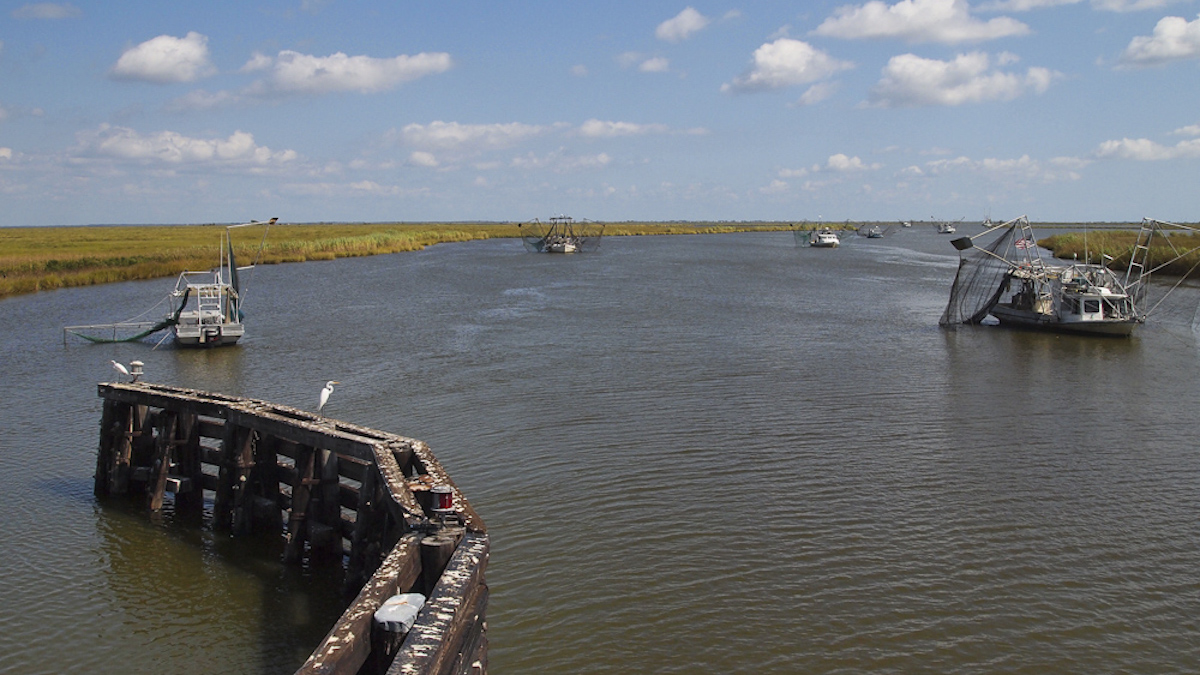
Mapping Sinking Land for Tribal Resilience in Louisiana
The Grand Caillou/Dulac Band of Biloxi Chitimacha Choctaw Tribe has been losing land to the sea, which could hamper efforts to gain federal recognition.

Posted inNews
El despertar del Popocatépetl: Transformando la vulcanología en México
La erupción del “Don Goyo” de 1994 en México central aceleró el interés académico en la vulcanología.


Posted inNews
Popocatépetl’s Wake-Up Call: Transforming Volcanology in Mexico
The 1994 eruption of “Don Goyo” in central Mexico accelerated an academic interest in volcanology.

Posted inNews
Maps Strengthen Collaboration Between Tribes and Federal Agencies
As U.S. agencies commit to better incorporating Indigenous viewpoints, maps could be one important tool.
Posted inNews
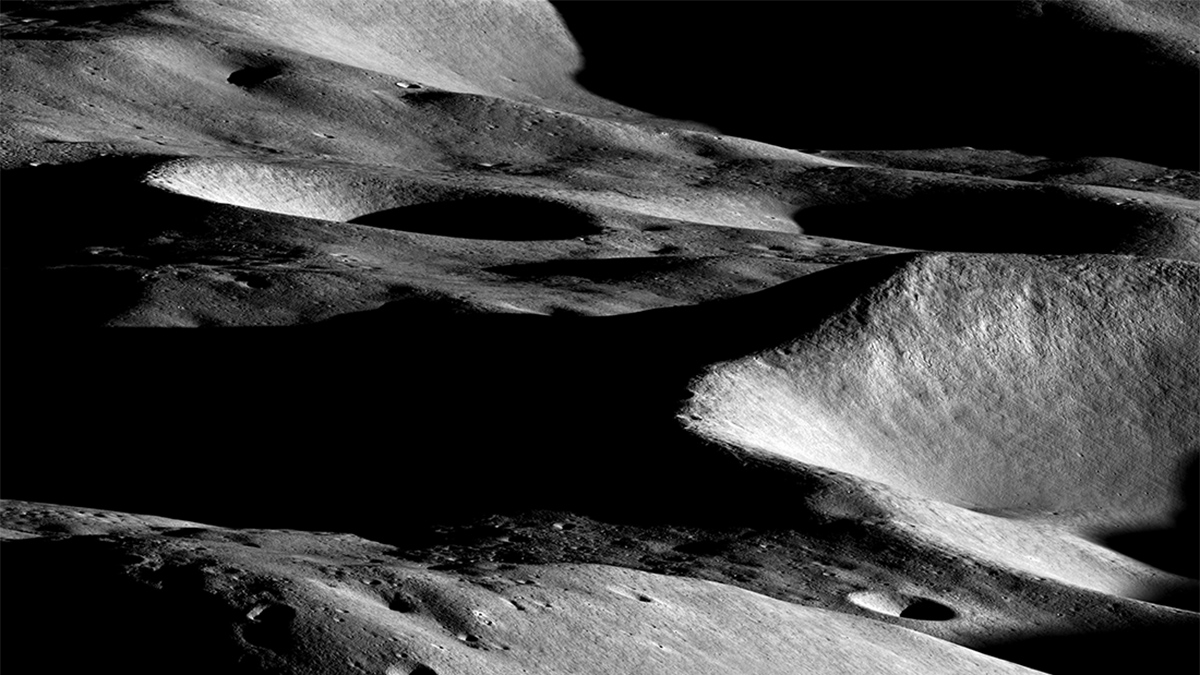
Mapping the Moon to Shield Astronauts from Radiation
Scientists are charting landing spots that offer future lunar astronauts protection from the Sun and deep space.