
Urbanization of a natural landscape can lead to increased levels of pollution—this is well known. However, haphazard development may also produce far-reaching effects, not only in the immediate vicinity but also across regional and perhaps global scales. This presents a potential problem for several eastern and western European countries, where the urbanization rate is 3 times greater than their population growth rate [European Environment Agency, 2006]. Such disproportional changes may have major environmental, socioeconomic, and geopolitical impacts.
We studied the Po Plain region in northern Italy, one of the most populated and urbanized areas in Europe, as a “pilot area” to investigate the environmental effects of urbanization. The Po Plain region (47,000 km2) covers 15% of the surface of Italy and hosts 34% of the country’s total population.
Mountainous topography around the Po Plain limits air circulation with the surroundings. The region is one of the most polluted in Europe, with the city of Milan being a major world hot spot of atmospheric nitrogen dioxide (NO2). Groundwater in the region also suffers: The Po Plain is classified in European Community Nitrate Directive 91/676/EC as one of Europe’s most vulnerable areas to nitrate contamination.
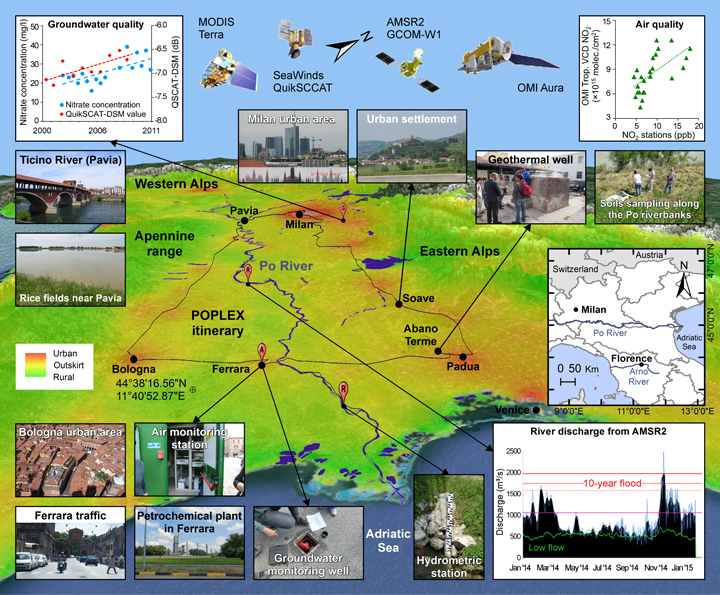
To investigate urban change and its effects, we conducted the Po Plain Experiment (POPLEX) in May 2014 within the central eastern part of the Po Plain (Figure 1), with an extension to Florence in Tuscany. We used data from multiple satellites, collected over a span of decades. We also used data from on-the-ground networks, together with hydrologic, geologic, demographic, and socioeconomic data and model estimates.
Eyes in the Sky
In addition to using traditional methods for land use and land change observations, we applied an innovative mathematical approach to process scatterometer data from NASA’s Quick Scatterometer (QuikSCAT) satellite, observing and analyzing urban patterns and changes at a scale of ~1 kilometer, throughout the 2000s [Nghiem et al., 2009]. The new method, called the dense sampling method (DSM), enabled us to understand the spatial and temporal evolution of environmental features with a combination of both anthropogenic and natural factors—including atmospheric, geophysical, and hydrogeological characteristics.
The objective of POPLEX was to investigate patterns of urban and population changes, groundwater quality, air quality, and changes of stream flow along the Po River.
The objective of POPLEX was to investigate patterns of urban and population changes, groundwater quality, air quality, and changes of stream flow along the Po River. The project involved 27 participants from 15 institutions located in five countries (Italy, United States, United Kingdom, Belgium, and Germany). The Regional Agency for Environmental Protection of Emilia-Romagna was a key stakeholder, in that they took a great interest in the methods and results of this project.
The campaign used data from 12 satellites and extensive field networks with 220 meteorological stations, 170 air monitoring stations, 500 groundwater monitoring wells, and 20 river gauges, together with census data and survey maps of land cover and land use change.
POPLEX is a pilot campaign, but it was designed to be applicable to other study areas, so that similar campaigns can be conducted in different regions of the world. Many countries already maintain public monitoring networks that provide relevant environmental measurements. The satellite data used for POPLEX were acquired globally, and temporal data analyses can be replicated and updated as new data become available. Where environmental data are limited or unavailable, proxies can be derived from multiple satellite data sets representing environmental changes.
POPLEX’s methodologies and results are being published in scientific journals and made available through its website to make the campaign more visible and to encourage a wider community to make use of the newly developed approaches and findings. (More information on this study is available here.)
Water Quality and Quantity
Using the QuikSCAT-DSM satellite data, we were able to detect various urban changes—even in areas where urban growth occurred at a relatively low rate. When we used QuikSCAT-DSM data to analyze nitrate in groundwater, we were able to identify a clear, direct relationship between urbanization and nitrate contamination trends.
We found groundwater contamination below newly developed neighborhoods as a result of the urban sprawling that occurred during the last decade.
An analysis of urban and agricultural nitrate sources indicates urban nonpoint sources of contamination as the main cause of groundwater quality deterioration in the area. The data enable a suitable approach to identify and characterize areas showing groundwater quality deterioration—a requirement of European Union Groundwater Directive 2006/118/EC [Stevenazzi et al., 2015a]. On a local scale, we looked for impacts on water quality and water quantity in two case studies in an urbanized area of the eastern Po Plain. The city of Ferrara shows scattered groundwater contamination by chlorinated aliphatic hydrocarbons, caused by improper disposal of petrochemical wastes during the 1970s. We found groundwater contamination below newly developed neighborhoods as a result of the urban sprawling that occurred during the last decade.
These findings help to address human health problems in several ways. For example, deep aquifers used for drinking water can be contaminated because dense nonaqueous-phase liquids tend to migrate through hydraulic barriers like aquitards (underground water barriers made of clay, silt, or rock). Contaminated groundwater can also emit volatile compounds into the air, which can affect indoor air quality of the buildings above the contaminated area.
The Euganean Geothermal Field, one of the largest thermal areas in Europe, demonstrates effects of urban sprawl on water demand. Since the 1950s, more than 400 wells, some as deep as 1000 meters, have been drilled to exploit the warm groundwater for therapeutic and recreational tourism. Increasing demand by spa facilities in the last 40 years has proportionally stressed the thermal groundwater quantity in the region.
Urbanization and Air Pollution
We also investigated how urbanization affects air quality. We carried out analyses to cross compare NO2 levels taken by the Ozone Monitoring Instrument aboard the NASA Aura satellite with ground-based measurements [Stevenazzi et al., 2015b].
Air pollution seems to be less affected than water pollution by the growth of urban areas, indicating the efficacy of environmental policies adopted in the last 20 years to improve air quality. On a large scale, we observed fair agreement between satellite NO2 data and observations taken from ground stations, far from NO2 point sources, that measured the background value.
On a local scale, areas characterized by the most extensive sprawl showed an increase in air pollution along main roads, related to the increase in vehicle traffic.
On a local scale, areas characterized by the most extensive sprawl showed an increase in air pollution along main roads, related to the increase in vehicle traffic. On weekdays, the highest pollution values are around large cities, where many industries are located, people go to work, and freight traffic is heavy. During weekends and holidays, when commercial activities and traffic are reduced, NO2 concentration decreases, especially around large cities.
What’s Next?
We plan to use satellite and on-the-ground measurements of river discharge along the Po River to investigate how changes in land use influence surface water availability and river regime (a measure of the changes in river discharge). This knowledge could improve our ability to forecast flood hazards exacerbated by urban change.
We will use QuikSCAT-DSM observations and field survey in the Florence-Prato Plain (Figure 2) to characterize the pattern of newly built-up pockets of urbanization. We believe that our study is a successful example of how satellite data tracking land surface changes can be used innovatively in assessing many environmental issues such as groundwater quality and quantity and air quality.

Acknowledgments
The research carried out at the Jet Propulsion Laboratory, California Institute of Technology, was supported by the NASA Land-Cover and Land-Use Change Program. The research carried out at the University of Southampton was done in the framework of the WorldPop Project.
References
European Environment Agency (2006), Urban sprawl in Europe: The ignored challenge, Rep. 10/2006, Off. for Off. Publ. of the Eur. Communities, Luxembourg.
Nghiem, S. V., et al. (2009), Observations of urban and suburban environments with global satellite scatterometer data, ISPRS J. Photogramm. Remote Sens., 64(4), 367–380.
Stevenazzi, S., et al. (2015a), Groundwater vulnerability maps derived from time dependent method using satellite scatterometer data, Hydrogeol. J., 23(4), 631–647.
Stevenazzi, S., S. V. Nghiem, and M. Masetti (2015b), Urban impacts on air quality observed with remote sensing and ground station data from the Po Plain Field Campaign, paper presented at International Geoscience Remote Sensing Symposium, Inst. of Electr. and Electron. Eng., Milan, Italy.
Author Information
Marco Masetti, Università degli Studi di Milano (UNIMI), Milan, Italy; email: [email protected]; Son V. Nghiem, Jet Propulsion Laboratory, California Institute of Technology, Pasadena; Alessandro Sorichetta, University of Southampton, Southampton, U.K.; Stefania Stevenazzi, UNIMI, Milan, Italy; Paolo Fabbri and Marco Pola, Università degli Studi di Padova, Padua, Italy; Maria Filippini, Alma Mater Studiorum Università di Bologna, Bologna, Italy; and G. Robert Brakenridge, Community Surface Dynamics Modeling System, Institute of Arctic and Alpine Research, University of Colorado, Boulder, Colo.
Citation: Masetti, M., S.V. Nghiem, A. Sorichetta, S. Stevenazzi, P. Fabbri, and M. Pola, M. Filippini, and G. R. Brakenridge (2015), Urbanization affects air and water in Italy’s Po Plain, Eos, 96, doi:10.1029/2015EO037575. Published on 23 October 2015.
Text © 2015. The authors. CC BY-NC 3.0
Except where otherwise noted, images are subject to copyright. Any reuse without express permission from the copyright owner is prohibited.