

Plants, algae, and some kinds of bacteria—collectively known as primary producers—absorb carbon dioxide from the atmosphere to produce the energy and cell structures they need to live. Animals and microbes feed on these primary producers, converting the ingested carbon and nutrients for their own use. When organisms then die, the carbon they contain is returned to the soil, air, or water, and the cycle begins again.
Sounds straightforward, right? Yes—and no. It turns out that getting an accurate and precise accounting of carbon flows in the fundamental process of primary productivity is tricky, to say the least, especially in the ocean. Part of the difficulty is that there are many ways to measure this process, and each tells us about a distinct part of the carbon cycle. It is also unsettling that the answers we get from a single measurement method can vary substantially because primary productivity is a complex process influenced by many nuanced factors, from the nutrients in seawater to the time of day.
Researchers have recently attempted to resolve some of this complexity about oceanic carbon measurements by seeking international consensus on how various measurements should be made. The outcome was a detailed document of methods and best practices published by NASA and the International Ocean Colour Coordinating Group (IOCCG). The document represents an important step in reducing measurement uncertainties. When these uncertainties are not fully understood or accounted for, the result is ambiguity in the interpretation and comparability of ocean carbon data, which limits their usefulness for developing global carbon cycle models that we need to understand our planet and project future conditions.
A Primary Process
Exchanges of carbon throughout our biosphere are essential processes that sustain life.
Exchanges of carbon throughout our biosphere are essential processes that sustain life. The ocean plays a central role in this global exchange program, for example, storing upward of 50 times more carbon than what is found in the atmosphere at any given time.
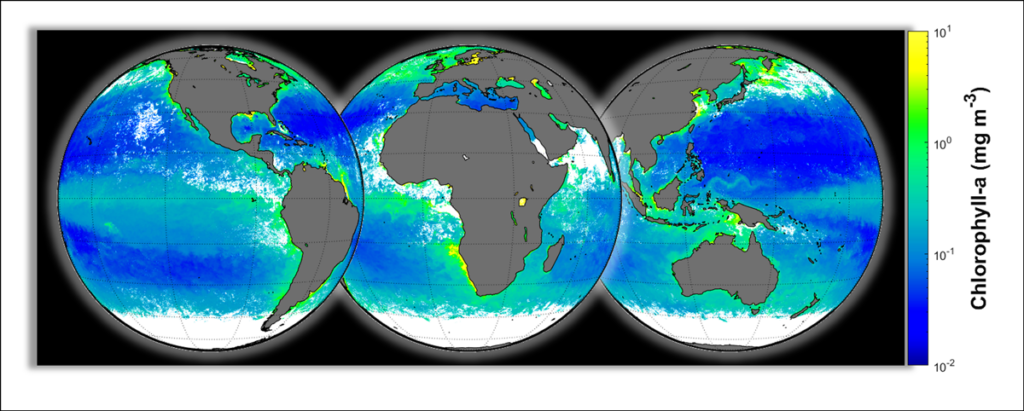
From the vantage of space, we can observe the amazing initiation of the carbon cycle as sunlight and nutrients spur growth of microscopic aquatic plants (phytoplankton) at the surface—sometimes in vast, swirling blooms. Seasonal variations in ocean chlorophyll levels, visible as changes in the green coloration on the ocean’s surface, track the blooming and receding of phytoplankton, as shown in the following video. (The music in the video is a sonification of the chlorophyll data depicted visually.)
Phytoplankton convert inorganic carbon dioxide into more biologically usable forms of organic carbon as it enters the food web. Much of this organic carbon is recycled near the ocean’s surface, but a substantial portion sinks into deeper waters before being converted back into carbon dioxide by marine bacteria. Storm-induced mixing and ocean currents eventually return this deep “stored” carbon to the surface, but some of it is sequestered for centuries. Broadly speaking, the rate of carbon conversion, or fixation, from inorganic to organic forms by marine plankton is known as oceanic primary productivity, which scientists strive to measure accurately to better understand the controls on the movement and exchange of some carbon in the ocean.
In the field, primary productivity is usually determined by directly measuring the uptake of carbon dioxide in seawater or, alternatively, the output of oxygen—these processes generally (but not always) happen in rough proportion to one another. To scale information from such measurements to a global context, scientists pair field data with satellite observations of our breathing planet to help create, test, and tune mathematical and computer models of the carbon cycle.
The Answers Depend on the Questions
So what is so challenging about accurately and consistently measuring the activity of microscopic phytoplankton in the ocean? For one thing, there are many ways to characterize primary productivity, each of which has its own name and describes a different part of the carbon cycle in the ocean (Table 1).
Table 1. Processes and Measurement Approaches Related to Aquatic Primary Productivity
| Process name | Description | Methodsa |
| Gross primary productivity | The total amount of light energy absorbed by phytoplankton | Fluorescence (Ch. 9), chlorophyll sensor estimates (Ch. 10) |
| Gross oxygen productivity | The amount oxygen released (a measure of energy captured) through the light-harvesting reactions of photosynthesis | Triple oxygen isotopes (Ch. 7), oxygen-18 tracer addition (Ch. 4), fluorescence flash yields (Ch. 9) |
| Gross carbon productivity | The amount of carbon dioxide converted into organic carbon in the Calvin-Benson cycle | Short-term (<2 hours) carbon isotope uptake (Ch. 3), delta light-dark oxygen measurements (Ch. 5, 6) |
| Net oxygen productivity | The amount of oxygen produced after accounting for all oxygen reduced during phytoplankton respiration | Light-dark bottle incubations (Ch. 5), oxygen electrodes and optodes (Ch. 6) |
| Net primary productivity | The amount of organic carbon produced after accounting for plankton metabolism (i.e., cell division, DNA replication, respiration, biosynthesis) | Dusk-dawn carbon isotope uptake (Ch. 3) |
| Net community productivity | The amount of carbon that escapes degradation by other organisms (e.g., the ocean surface microbial community) and is available for export below the photic zone | Oxygen-argon ratios (Ch. 8), optics or biogeochemical sensor–derived estimates (Ch. 10) |
For example, gross primary productivity refers to the total amount of solar energy absorbed during photosynthesis and represents the overall energy budget available for phytoplankton to grow and multiply. Some of this energy is used by phytoplankton to fix inorganic into organic carbon (i.e., gross carbon productivity). A portion of this organic carbon is then used to sustain the life of the phytoplankton that produced it. What remains is net primary productivity, or the amount of carbon (biomass) available for other organisms to consume. The amount of phytoplankton carbon that escapes consumption in the ocean’s photic zone is known as net community productivity, which helps scientists estimate how much of this carbon is available to sink into the deep ocean for storage. Other terms describing other processes—namely, gross oxygen productivity and net oxygen productivity—exist as well.
Confoundingly, none of these processes are directly observable at scales relevant to global carbon cycling, which is why satellite observations and models that can add global context are needed.
Adding to the challenge is the fact that each of these processes can be measured using different methods, and the method chosen depends on what question is being asked and at what scale that question is relevant. For example, to estimate net primary productivity, measurements of radioactive (14C) or stable (13C) carbon isotope uptake in a bottle of seawater can be made in a lab, and controlled experiments can be run to see how the uptake changes in direct response to changes in light exposure or temperature. However, there are also advantages to using oxygen sensors deployed in the ocean to measure the larger-scale effects of carbon uptake in nature. This latter approach doesn’t require removing phytoplankton from their native environment, and the results can be representative of a larger portion of the ocean or longer timescales.
Confoundingly, none of these processes are directly observable at scales relevant to global carbon cycling, which is why satellite observations and models that can add global context are needed. Thus, it is important to learn not only how to measure primary productivity accurately but also what variables affect the cycle and how, so that the global models can be parameterized correctly.
This situation creates a sort of paradox for scientists measuring ocean carbon. Is it best to choose one process and one measurement approach and focus on doing that as well as possible? Or do we study different processes and apply different methods, with all their attendant uncertainties and scales, to examine primary productivity from as many angles as possible? Is more always better?
A Holistic and Integrated Approach
The viewpoint of the group who produced the new protocol document, which included me and 26 other specialists in aquatic primary productivity from around the world, is that each method and approach presented elucidate distinct processes and can contribute to a holistic and integrated characterization of aquatic carbon dynamics. The group’s primary goal is to standardize a variety of emerging technologies and to revisit and update older, heritage approaches. In doing so, we hope to improve simultaneously our understanding of the spatial and temporal dynamics of the carbon cycle at large scales and how plankton cell physiology is intrinsically linked to and influences these dynamics at small scales.
By spelling out consensus best practices for a wider range of methods than has been used before, we can better leverage the assets and document the liabilities of each one.
The idea is for these methods and protocols to be used complementarily to improve this understanding. By spelling out consensus best practices for a wider range of methods than has been used before—and being transparent about the methods’ capabilities, limitations, and underlying assumptions—we can better leverage the assets and document the liabilities of each one.
Of course, scientists can be even more finicky than the phytoplankton they measure. So consensus on how different measurements should be made is not always easy to come by, especially when many research groups have customized their own approaches over many years.
For this effort, we followed a successful template used in previous iterations of the IOCCG protocol series to help achieve agreement, beginning with a 3-day workshop in December 2018. Through a series of presentations and interactive sessions, attendees discussed issues, nuances, definitions, scales, and uncertainties pertaining to aquatic primary productivity measurements.
At the end of the workshop, participants were assigned to groups and tasked with writing a chapter of the protocol document addressing a method related to their expertise. The authors then collaborated remotely to agree on best practices and, after arduous discussion and revisions, write their chapters. Some methods were written up with cookbook-style instructions. Some in situ methods (e.g., measurements from autonomous platforms) do not lend themselves to the same level of rigid specificity, however, so authors instead offered guidance on dos, don’ts, and best practices informed by their own experiences and perspectives.
After the author groups submitted their chapter drafts in August 2021, the document was released to the public for a 90-day comment period, enabling broader engagement from the international community. Following this period, expert associate editor peer reviewers independently reviewed chapters and managed the public comments and author responses. Finally, about 3 years after the opening workshop, the final document—representing broad consensus and a great deal of effort and compromise to overcome disagreements—was released.
A Global View of Primary Productivity
This collection of standardized methods for field measurements represents a major, albeit single, step toward reconciling localized field data with the broad-scale estimation of primary productivity.
This collection of standardized methods for field measurements represents a major, albeit single, step toward reconciling localized field data with the broad-scale estimation of primary productivity. Combining field measurements, satellite observations, and modeling efforts is the only viable path to gauge marine carbon fixation rates at a global scale.
Scientists frequently test the performance of numerical models through validation exercises. For some measurements, such as of chlorophyll a, validation is a relatively straightforward process in which data measured at sea are compared to values estimated from models. However, the complexity of primary productivity in its entirety hinders clear-cut validation. Many factors, such as water temperature, light exposure, nutrient levels, phytoplankton type, and time of day, affect the rate and efficiency of carbon fixation by primary producers, and these parameters can vary substantially across the ocean and in models.
“End-to-end” validation of primary productivity in carbon cycle models requires the assessment of parameters used as model inputs as well as intermediate and final outputs to better constrain their variability. Current model validation efforts tend to focus solely on validating final outputs, which is no small effort in itself. Still, more holistic validation activities are needed, and they would benefit from the availability of field measurements used in newer types of primary productivity models, such as light absorption and backscattering by phytoplankton, chlorophyll fluorescence, and spectrally resolved light penetration.
Data from additional types of field measurements can help scientists better assess the sensitivity of model parameters. There are also benefits for model validation of increasing the sheer volume of data collected. The global network of Argo floats equipped to collect biogeochemical data is one effort contributing to the push for more data. These floats could enable estimates of primary productivity all over the world.
Further merging such in situ observations with remotely sensed ocean color data and numerical biogeochemistry and ecosystem models could fuel a new generation of tools to help scientists grasp global-scale ocean primary productivity. As we move toward that goal, we are confident that the best practices and protocols laid out in the new NASA-IOCCG document will help guide researchers to collect the high-quality, standardized data needed to advance our understanding of global ocean carbon dynamics.
Author Information
Ryan Vandermeulen ([email protected]), Science Systems and Applications, Inc./NASA, Greenbelt, Md.; now at National Marine Fisheries Service, NOAA, Silver Spring, Md.