The Earth has moved, and you need to know where, how much, and why. Imagine you are a volcanologist in Indonesia wanting to predict eruptions by detecting rapid land uplift. Or maybe you are a flood forecaster in Texas needing data on how fast the coast is subsiding. Perhaps you are a geologist in Tanzania who dreams of measuring the East African Rift slowly spreading apart.
What’s the one data set that can help you to do these things and more? It is the rich trove of information from GPS. The good news is that you have free access to this treasure trove in a one-stop shop, provided by the Nevada Geodetic Laboratory (NGL).
The same data can be used to study the tectonics of continental rifting or to improve the global reference frame for studies of global sea level change.
NGL takes raw GPS data from more than 17,000 stations around the globe and makes data products that are multipurpose: For example, the same data can be used to study the tectonics of continental rifting or to improve the global reference frame for studies of global sea level change.
Anyone can access all these data through our portal. But opening up all these data to everyone is only one step. We recognize that the sheer volume of the total set of GPS data is overwhelming. So we’ve built an interface that lowers the barrier to participation by novice users of GPS data and allows them to pursue their own investigations.
Geodesy and Beyond
Thanks to a series of innovations and exponential growth over the past 3 decades, GPS has become an important tool for geodesy and geophysics, pushing forward the science and precise measurement of the Earth’s various active processes on land, water, and ice and in the atmosphere. GPS now forms an integral component of the newest generation of Earth science and natural hazard assessment capabilities for monitoring and understanding earthquakes, tsunamis, volcanoes, mountain growth, aquifers, sea level, glaciers, ice sheets, mantle flow, terrestrial water storage, and water vapor, to name a few.
The field of geodesy—which measures the size, shape, gravitational field, and spin of the Earth and how they all change over time—was the first to use GPS for science. In fact, geodesy had been instrumental in improving GPS data analysis that enables pinpoint positioning using high-precision equipment. But now, the scope of applications is broadening rapidly.
We are witnessing an exponential explosion in the number of geodetic-quality GPS stations around the globe.
We are witnessing an exponential explosion in the number of geodetic-quality GPS stations around the globe, in the amount of data collected, and in the quantity and variety of data products for scientific applications. This explosion is both a cause and an effect of scientists starting to use GPS data from many traditionally nongeodetic disciplines. Moreover, feedback from multiple disciplines leads to improved models of geodetic observables, thus improving GPS data products for all.
Harnessing the GPS data explosion is therefore essential to enabling new applications and discoveries. Doing this requires implementing an operational system that lowers the barrier to participation by novice users of GPS data and allows them to pursue their own investigations.
NGL’s operational system fills this need. What’s more, we foster geoscience collaboration and education by making our GPS data products—information derived from more than 17,000 stations—open access.
A Changing Landscape
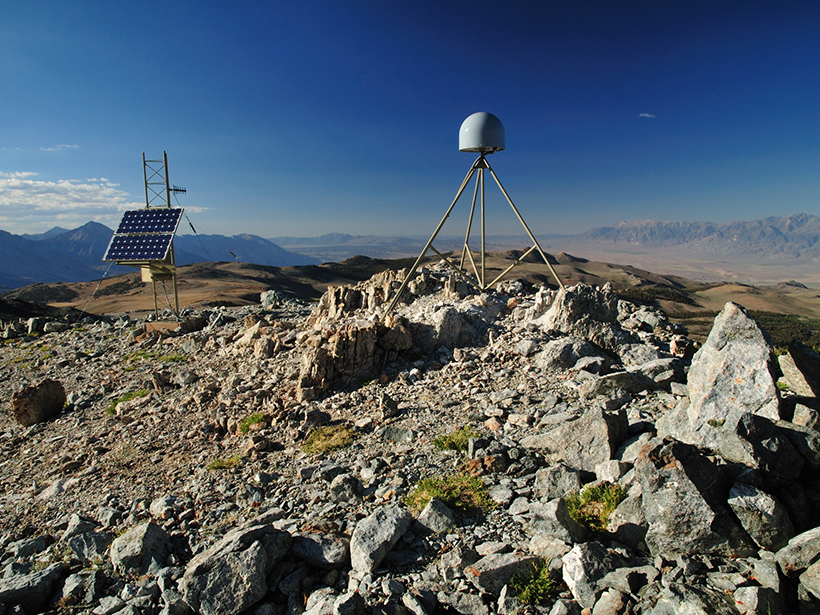
In the early days of GPS, geodesists expended enormous effort to improve positioning precision for regional networks of just a few GPS stations. Now we obtain and process data from a global distribution of stations. NGL obtains all the available geodetic GPS data—currently from more than 17,000 stations (Figure 1)—to place every observation in the context of every other observation in a global frame of reference aligned with Earth’s center of mass.

Managing the resulting flood of data has challenged us to invent new processing strategies, automatic systems, algorithms, and robust estimation techniques. Our system now produces, and makes publicly available, data products such as position coordinates (latitude, longitude, and height) for all geodetic-quality GPS stations around the globe that are known to us with various data intervals, latencies (lag times between when data are collected and when they are available to use), and reference frames that might be useful to other users.
Hundreds of organizations collect, manage, and distribute the original data from these stations. These organizations cooperate under various service-oriented institutions, such as the International Global Navigation Satellite Systems Service (IGS) and UNAVCO, a university-governed consortium that facilitates geoscience research and education using geodesy.
In total, NGL scours more than 130 Internet archives in an attempt to find all possible useful GPS data so that users need to visit only one access point to get all the data products they require, from the scale of a city to the scale of the entire planet.
An Open-Access Resource
NGL makes its data products available online, including metadata, lists of stations, plots of position coordinates, tables of data holdings, and descriptions of new items relating to the products. Stations in a given field area can be found using a clickable and scalable interactive map. All products are openly available, many as simple text files, allowing data to be accessed automatically and built into analysis workflow.
Every week, NGL updates the daily position coordinates of some 10,000 stations. Every day, we update 5-minute position coordinates for more than 5,000 stations. Every hour, we update 5-minute position coordinates for about 2,000 stations. These lower-latency products have proved to be useful, for example, for gaining early insight into large earthquakes by measuring permanent coseismic displacements and postseismic displacements caused by fault after-slip and upper mantle relaxation.
NGL also routinely updates station velocities—the speed and trajectory at which stations are moving in the global reference frame—which can be used to image the rates of deformation of Earth’s surface for a variety of interdisciplinary applications. These velocities are estimated robustly using the Median Interannual Difference Adjusted for Skewness (MIDAS), a median-based GPS station velocity estimator that is insensitive to outliers, seasonality, step functions (abrupt changes) arising from earthquakes or equipment changes, and statistical data variability [Blewitt et al., 2016]. MIDAS also provides velocity error bars based on subsampling the data that prove to be realistic, for example, when comparing estimated velocities of stations that are close to each other or are separated by a tectonically stable region. Furthermore, documented step functions are made available, with links to known earthquakes and equipment changes.
Expanding Capabilities
The availability of precise GPS data that are dense in space and time is transforming how scientists model and visualize active Earth processes in ways we would never have imagined 3 decades ago.
For example, we recently extended our median-based robust techniques to map motions of Earth’s surface from GPS point data [Hammond et al., 2016]. Figure 2 shows the high resolution we can now obtain in the patterns of vertical crustal motion from various processes including glacial isostatic adjustment (GIA), the slow continent-scale relaxation of North America following the Last Glacial Maximum. Images such as this can help to constrain parameters of GIA models [Kreemer et al., 2018].

In this way, such complete automation of the processing of all potentially valuable data into freely available products allows everyone to focus more on discovery and interpretation of the results. This data-rich approach provides greater data redundancy, reproducibility, and statistical significance of scientific findings.
One person’s “noise” may actually be someone else’s signal.
There’s more: One person’s “noise” may actually be someone else’s signal. As a necessary part of accurately determining coordinates of GPS stations, geodesists need to model and estimate variability in atmospheric refraction of the GPS signal, which is strongly influenced by water vapor. Data products derived from these models are useful to scientists for whom atmospheric refraction is a nuisance (e.g., those calibrating satellite radar data). To support research in using these products, NGL recently made a new data product publicly available: the time series of tropospheric refraction parameters (i.e., total zenith delay and 2-D gradient in delay) every 5 minutes starting in 1996 from all available GPS stations.
But this refraction information—a globally and temporally self-consistent data set of 35 million daily station files—provides finely detailed data on the time evolution of atmospheric water vapor. This information, when combined with other data sets, can help with studies of how climate has behaved over the past 2 decades.
Quality assurance (QA) data are also provided daily for every station on the basis of statistical analysis of the processed data, such as how well models fit the raw observations. Investigators can use QA data to validate data products before they are ingested into geophysical analysis, for example, to identify when GPS data start to degrade because of equipment failure. QA data can also identify which GPS stations provide the highest-quality data and which are subject to such environmental effects as excessive multipath error (caused by reflected GPS signals in the station environment) or sky obstructions.
Benefits of Open Access
Even fundamental physics is fair game, as we collaborate with physicists using the constellation of GPS atomic clocks as a giant dark matter detector.
The success of this enterprise depends critically on the principle of open availability of GPS data provided by contributing networks. This availability allows us to provide open, online access to the data products. As a result, network operators can see how results from their data compare with those from other networks, and it allows data users to quickly access results without requiring advanced data processing expertise. This creates a win-win situation for everyone concerned.
Motivated by this, NGL and UNAVCO jointly developed the Plug and Play GPS project, funded by NASA’s Advancing Collaborative Connections for Earth System Science (ACCESS) program. The goal of Plug and Play GPS is to reduce barriers for less experienced investigators wishing to participate in the geodetic community, for example, by installing new GPS stations in a region currently with sparse coverage, such as Africa. The idea is that any investigator can register a newly installed GPS station and deposit data at the UNAVCO archive, and in return NGL will process the data and provide the data products outlined above.

In our experience, the capability to process all known data in a robust turnkey fashion enhances opportunities for everyone to make scientific discoveries without necessarily preplanning all of the steps that lead to discovery’s door. For example, even fundamental physics is fair game, as we collaborate with physicists using the constellation of GPS atomic clocks (on board GPS satellites) as a giant dark matter detector [Roberts et al., 2017]. The idea is that forces of nature possibly associated with dark matter might affect the highest-precision devices ever invented: atomic clocks. Comparing atomic clocks in space is something GPS has been doing routinely for decades!
The possibilities are seemingly endless. NGL is committed to continuing to provide this long-running service to the scientific community, and we encourage researchers to explore these data sets and apply their creative skills to scientific investigations that have yet to be conceived.
Acknowledgments
This project was funded by NASA grants NNX12AK26G and NNX14AJ52A.
References
Blewitt, G., et al. (2016), MIDAS robust trend estimator for accurate GPS station velocities without step detection, J. Geophys. Res. Solid Earth, 121, 2,054–2,068, https://doi.org/10.1002/2015JB012552.
Hammond, W. C., G. Blewitt, and C. Kreemer (2016), GPS imaging of vertical land motion in California and Nevada: Implications for Sierra Nevada uplift, J. Geophys. Res. Solid Earth, 121, 7,681–7,703, https://doi.org/10.1002/2016JB013458.
Kreemer, C., W. C. Hammond, and G. Blewitt (2018), A robust estimation of the 3-D intraplate deformation of the North American plate from GPS, J. Geophys. Res. Solid Earth, 123, 4,388–4,412, https://doi.org/10.1029/2017JB015257.
Roberts, B. M., et al. (2017), Search for domain wall dark matter with atomic clocks on board Global Positioning System satellites, Nat. Commun., 8, 1195, https://doi.org/10.1038/s41467-017-01440-4.
Author Information
Geoffrey Blewitt (email: [email protected]), William C. Hammond, and Corné Kreemer, Nevada Geodetic Laboratory, Nevada Bureau of Mines and Geology, University of Nevada, Reno
Citation:
Blewitt, G.,Hammond, W. C., and Kreemer, C. (2018), Harnessing the GPS data explosion for interdisciplinary science, Eos, 99, https://doi.org/10.1029/2018EO104623. Published on 24 September 2018.
Text © 2018. The authors. CC BY-NC-ND 3.0
Except where otherwise noted, images are subject to copyright. Any reuse without express permission from the copyright owner is prohibited.