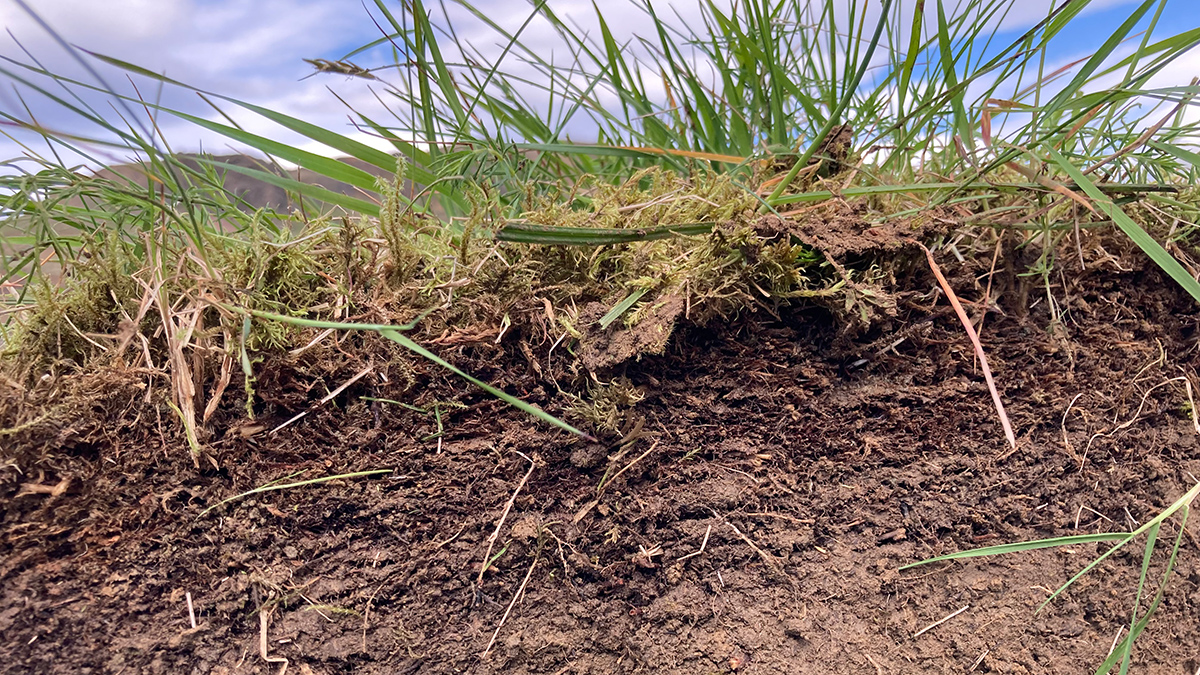
Scientists aim to integrate observations from deep-soil-warming experiments worldwide to better understand how ecosystems vital to food security and environmental health will react to climate change.
data management
Posted inEditors' Highlights
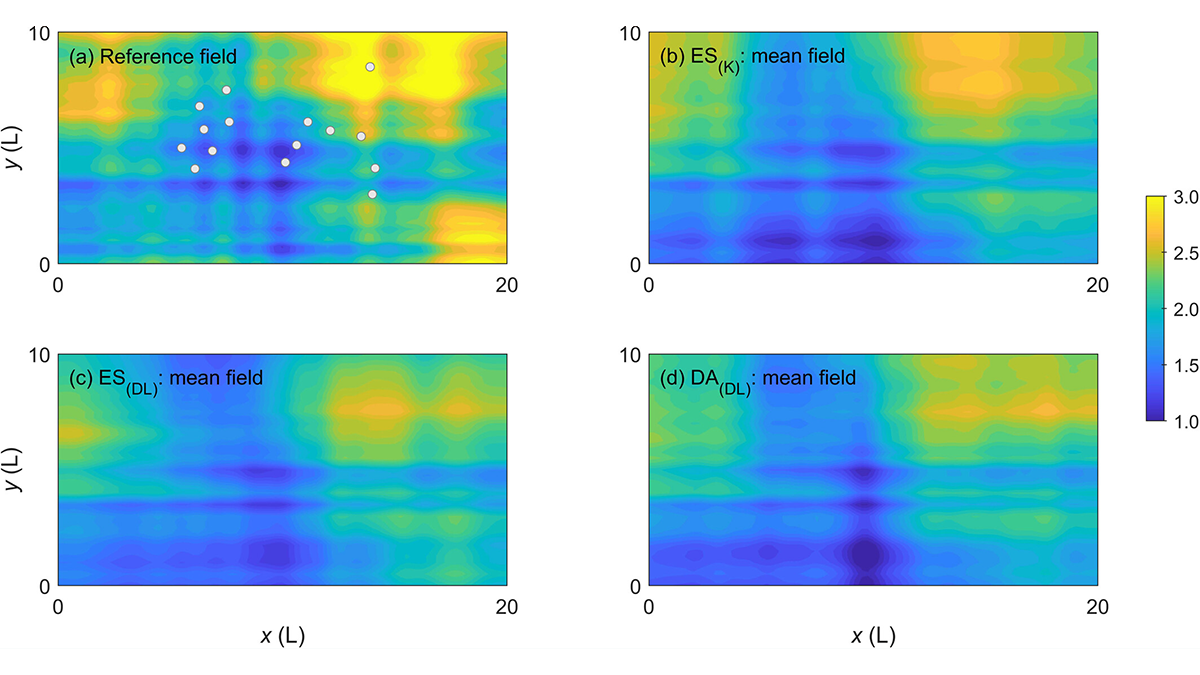
Learning Data Assimilation Without the Help of the Gaussian Assumption
Major Earth system processes are non-linear and non-Gaussian, and so should be our data assimilation approaches.
Posted inEditors' Highlights
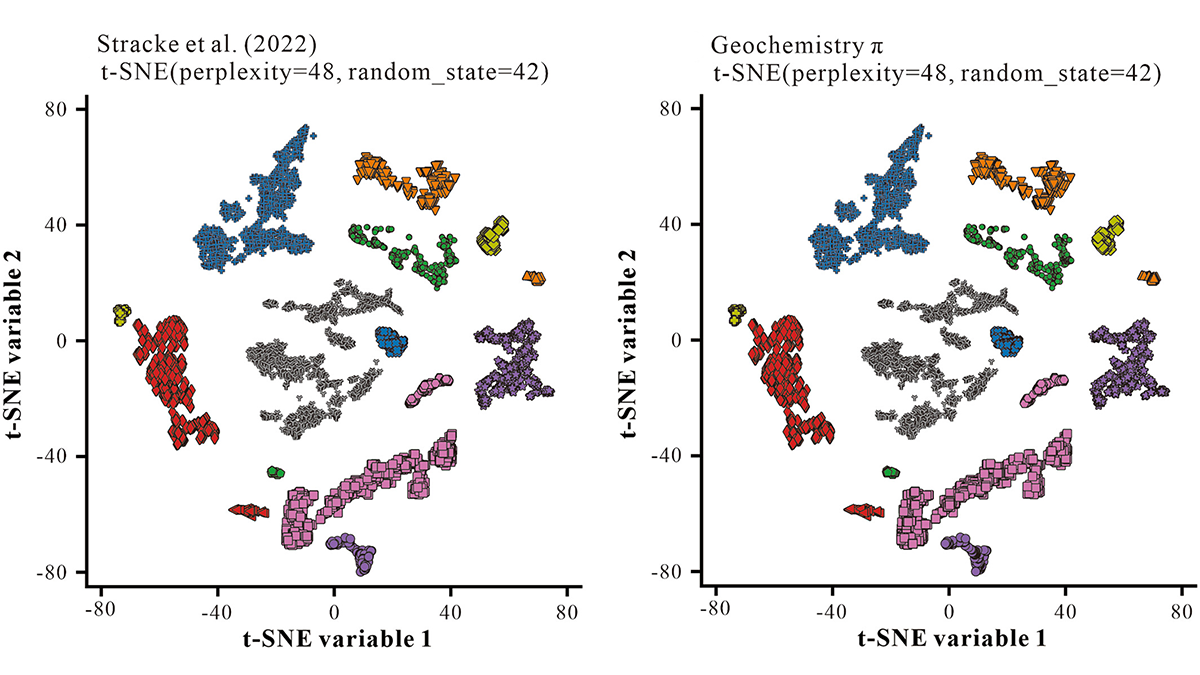
Machine Learning for Geochemists Who Don’t Want to Code
Geochemistry π is an easy-to-use step-by-step interface to carry out common machine learning tasks on geochemical data, including regression, clustering, classification, and dimension-reduction.
Posted inScience Updates
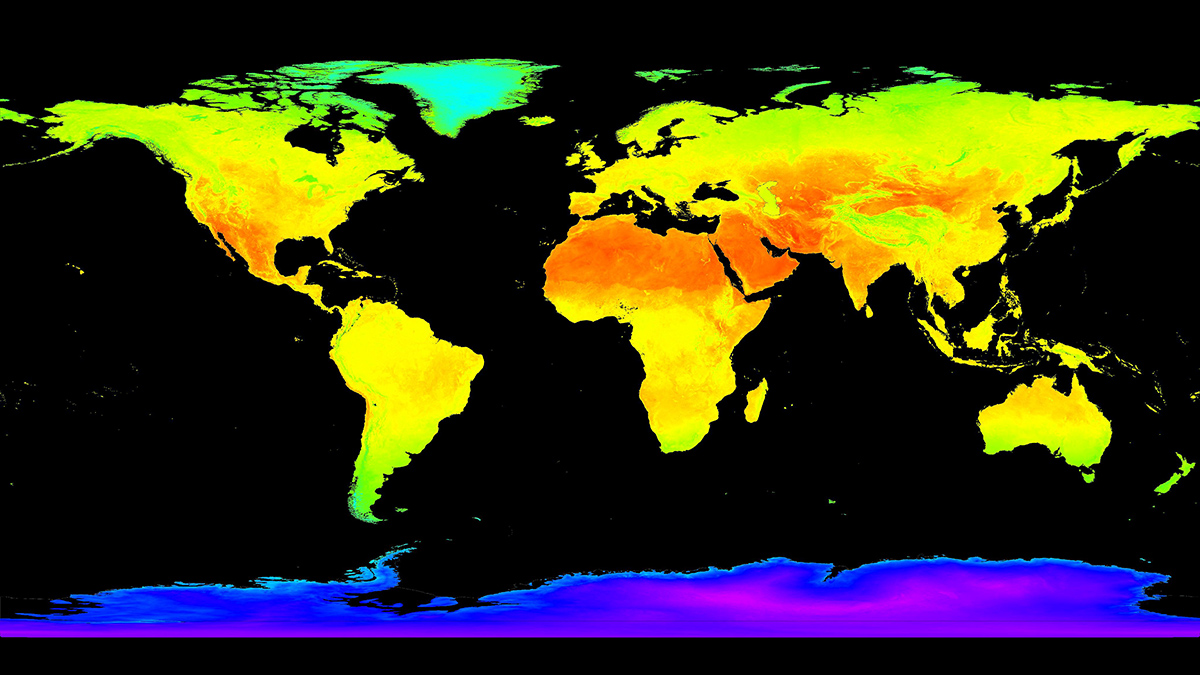
Trustworthy Satellite Earth Observations for Science and Society
Enhancing confidence in satellite observations of terrestrial properties like land surface temperature and soil moisture requires advances in validation and data quality assessment practices.

Posted inFeatures
The Importance of Archiving the Seafloor
Marine geological sample repositories are vital for ocean science, climate change studies, and more. The value of their collections is growing amid efforts to meet rising demand for their services.

Posted inScience Updates
Un enfoque holístico de los datos hidroeléctricos
Una nueva plataforma en línea ofrece extensos datos y herramientas sobre los recursos hidroeléctricos de EE. UU., lo que permite tomar decisiones basadas en datos en el nexo energía-agua.

Posted inENGAGE, News
Millions Likely Live in Areas Contaminated by Mining Runoff
Heavy metal contaminants from mining can live in ecosystems for centuries. A new global database shows where the problem is worst.

Posted inOpinions
How to Address Publication Overload in Environmental Science
Combining traditional human-curated syntheses of scientific research with the search and visualization tools of artificial intelligence could guide researchers through avalanches of publications.

Posted inNews
Where the Ground Gives Way
Sinkholes are a significant hazard, but where are they most likely to happen? A new study identifies hot spots in the contiguous United States.
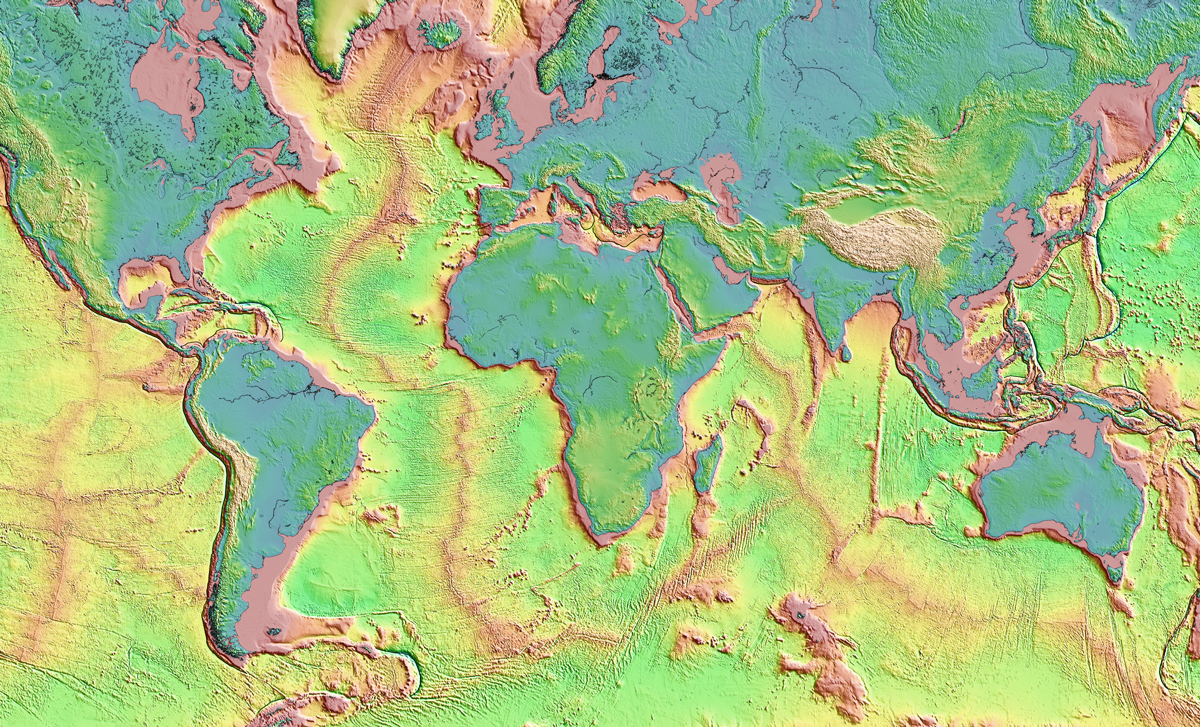
Posted inNews
A New, Underground Atlas of Subduction Zones
Submap merges graphic design with geodynamics, providing a fast, free, and user-friendly resource to map subduction zones.