
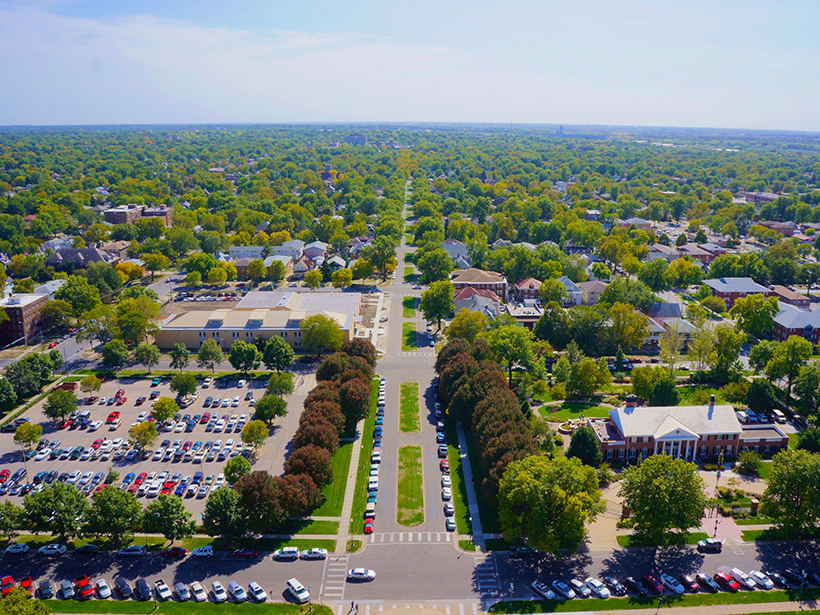
Machine learning and data on aquifer type, sediment thickness, and proxies for irrigation water use has been used to produce the most comprehensive map of land subsidence in the western U.S. to date.
mapping
Posted inNews
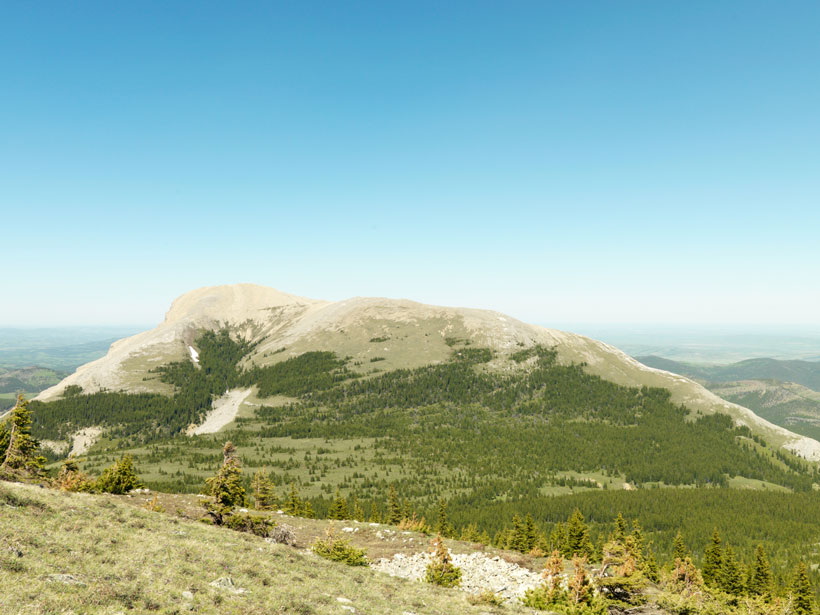
Canada’s Rocky Mountain Forests Are on the Move
Using century-old surveying photos, scientists have mapped 100 years of change in the Canadian Rockies to document the climate-altered landscape.
Posted inNews
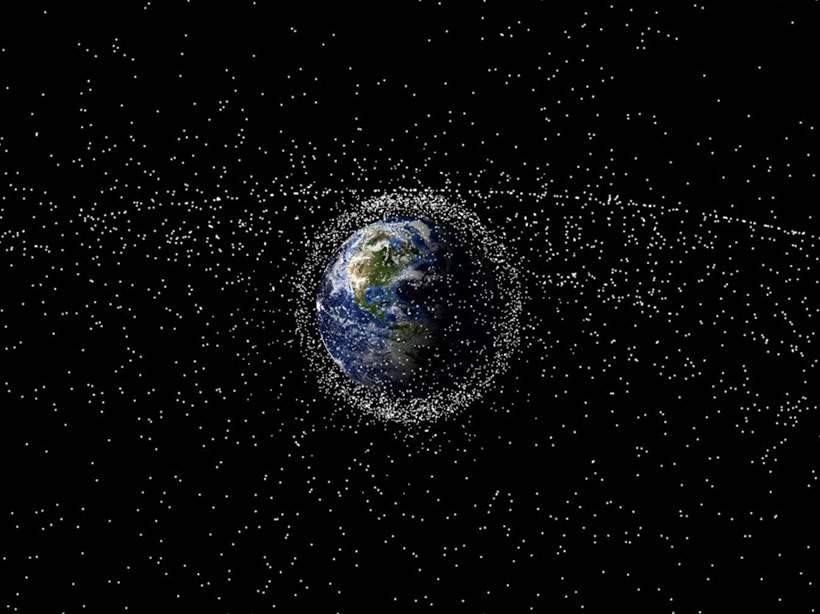
Flickers of Light Help Map the Space Junkyard
Researchers are identifying space debris by measuring its flickering patterns of reflected light.
Posted inScience Updates
Mapping Vegetation Health Around the World
A new spaceborne sensor monitors Earth’s surface temperature at a resolution higher than ever before, providing information on ecosystem responses to changes in water availability and climate stressors.
Posted inEditors' Highlights
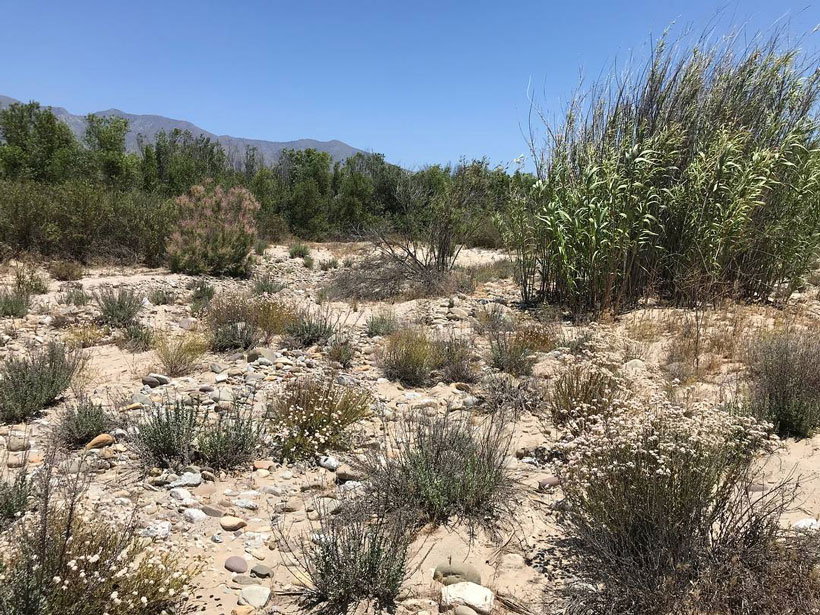
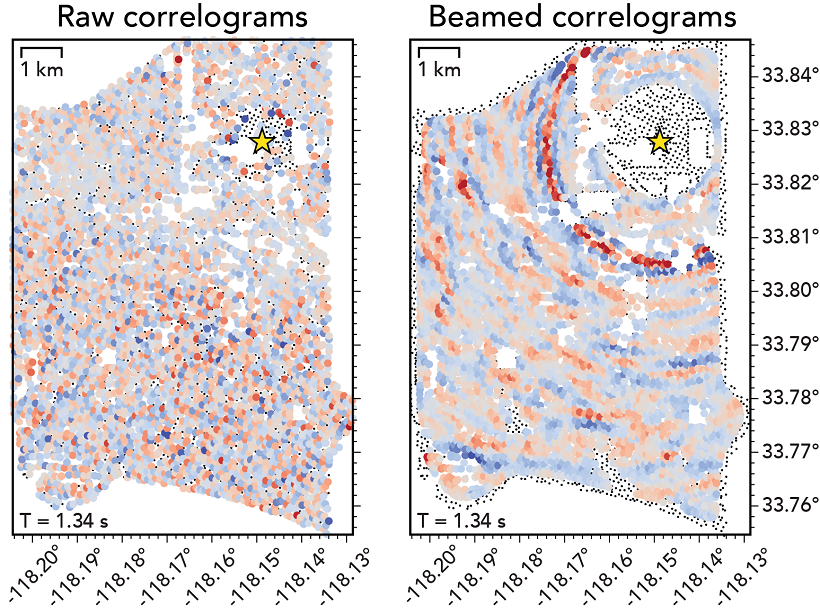
Fine-scale Structure Mapped by Body Waves Extracted from Noise
A novel processing scheme was used to extract refracted body waves from ambient seismic noise and investigate the small-scale structure around a fault at Long Beach, California.

Posted inNews
Water Ice Lurks in Young—but Not Too Young—Lunar Craters
Using topographic data, researchers have estimated the ages of water ice–containing craters near the Moon’s poles and ruled out volcanism as being a primary route for water delivery.
Posted inNews
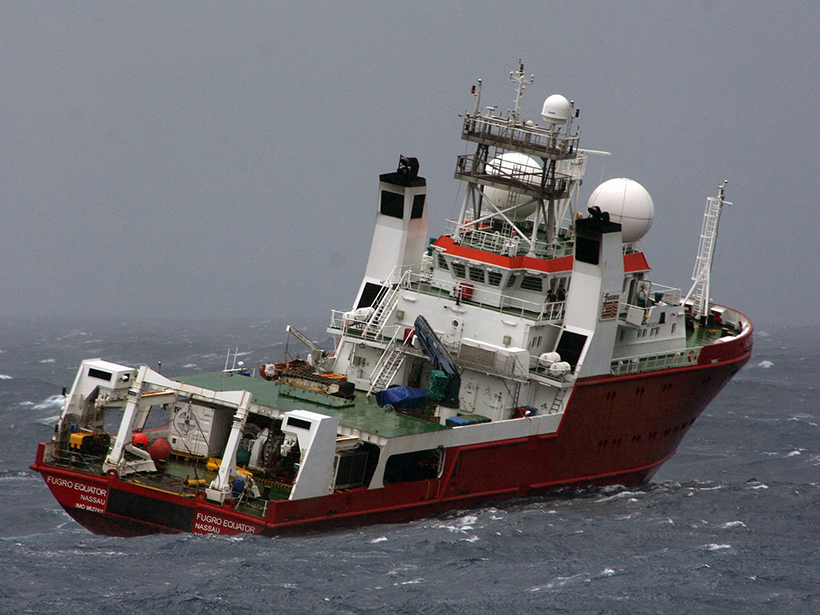
Search for MH370 Revealed Ocean Crust Waves
Efforts to recover the missing airplane produced high-resolution bathymetry of the southern Indian Ocean that raises new ideas about how ocean crust forms.

Posted inNews
How Machine Learning Redraws the Map of Ocean Ecosystems
Using an unsupervised learning algorithm, scientists can create new maps of ecosystem provinces in the ocean, opening the possibility of sharper data collection and monitoring.

Posted inNews
The First Global Geologic Map of the Moon
At a time when more geological data about the Moon are available than ever before, USGS scientists have created a one-stop shop where everyone, including the public, can see how it all fits together.
Posted inNews
Geoscientists Help Map the Pandemic
Data visualization and mapping are valuable tools in the fight against COVID-19. Geoscientists can help healthcare workers and shape public policy.