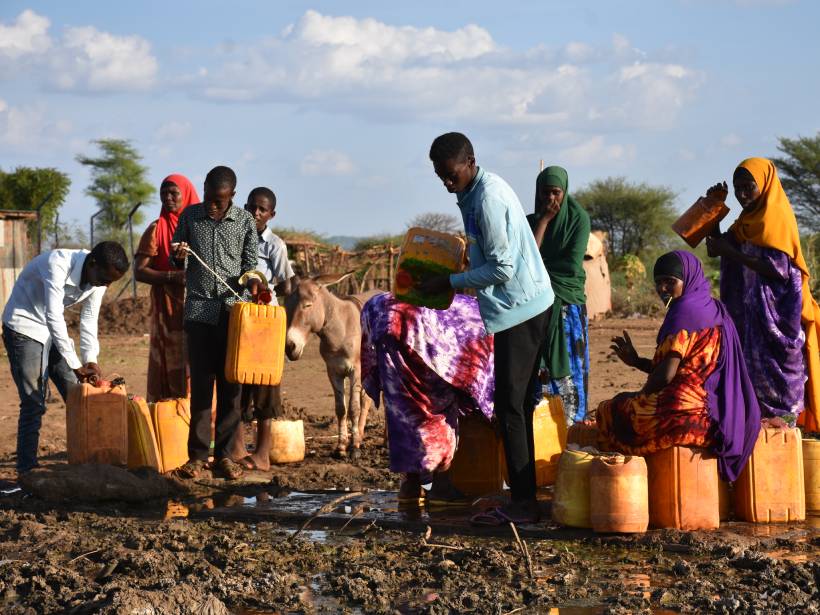
The continent-wide survey provides an assessment of the resilience of groundwater resources.
mapping
Posted inNews
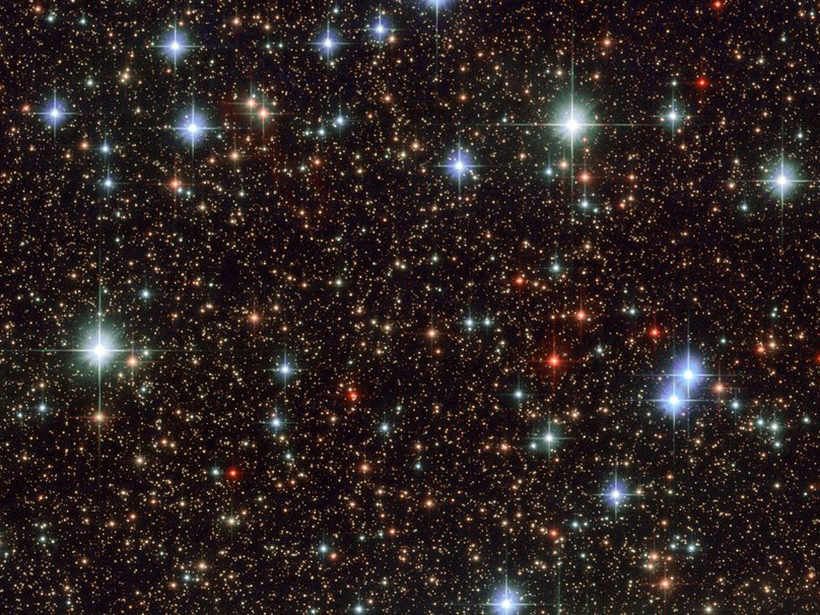
1.3 Million Pairs of Stars Surround the Sun
Roughly half of Sun-like stars have a stellar sibling, and a surprising fraction of those siblings are identical twins.
Posted inEditors' Highlights
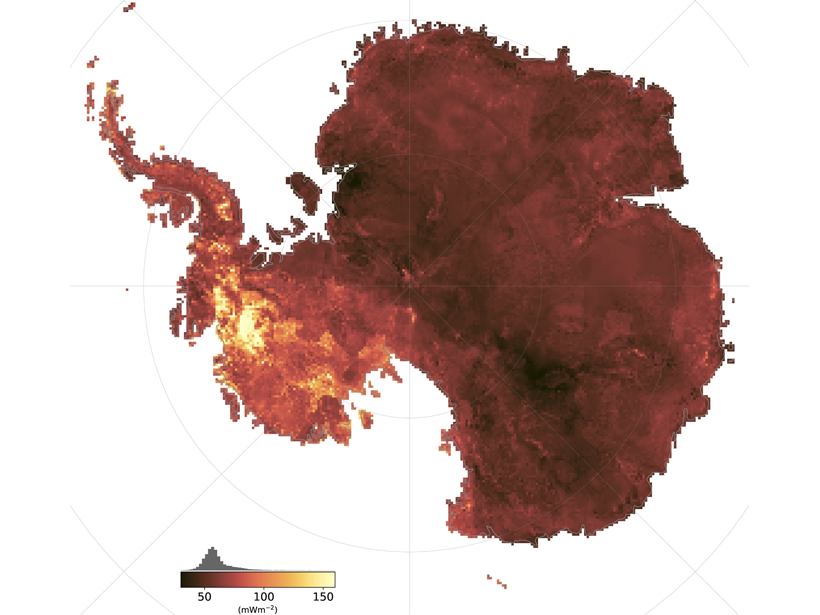
Taking the Temperature of Antarctica’s Crust
How do you measure the geothermal heat flux in a continent covered by an ice-sheet? A new study uses correlations of diverse global observables and produces a heat flow map of the entire Antarctica.
Posted inScience Updates
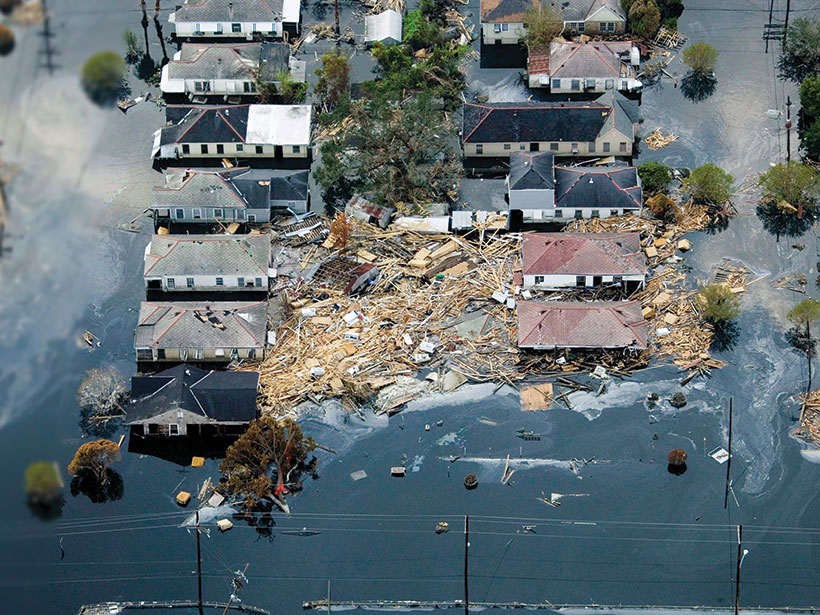
Assessing Social Equity in Disasters
Natural hazard impacts and resources allocated for risk reduction and disaster recovery are often inequitably distributed. New research is developing and applying methods to measure these inequities.

Posted inEditors' Highlights
Robot Measures Air-Sea Carbon Dioxide Exchange in Southern Ocean
Unique air and ocean surface observations of the Southern Ocean from a 22,000 km, 196-day circumnavigation around Antarctica by an Uncrewed Surface Vehicle.
Posted inEditors' Highlights
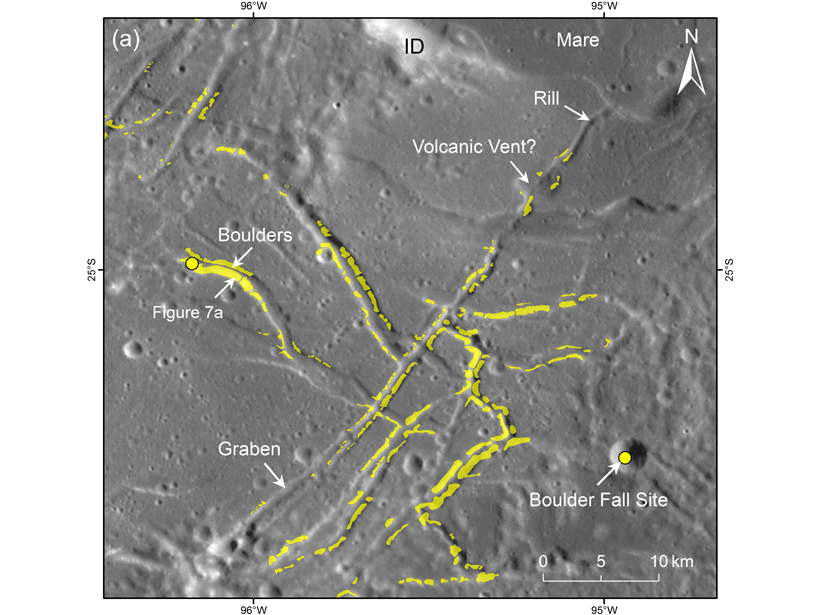
The Tumbling Boulders of Orientale Basin
Mapping boulder fields and boulder tracks highlights the seismic hazard still present on the Moon.

Posted inOpinions
Charting Satellite Courses in a Crowded Thermosphere
As the number of satellites in low Earth orbit grows by leaps and bounds, accurate calculations of the effects of atmospheric drag on their trajectories are becoming critically important.

Posted inResearch Spotlights
Certain Rock Formations Can Lead to In-Home Radon Risks
Researchers in Kentucky have merged results from home test kits with the state’s geologic map to produce a map of indoor radon potential based on the geology underlying homes in the state.
Posted inNews
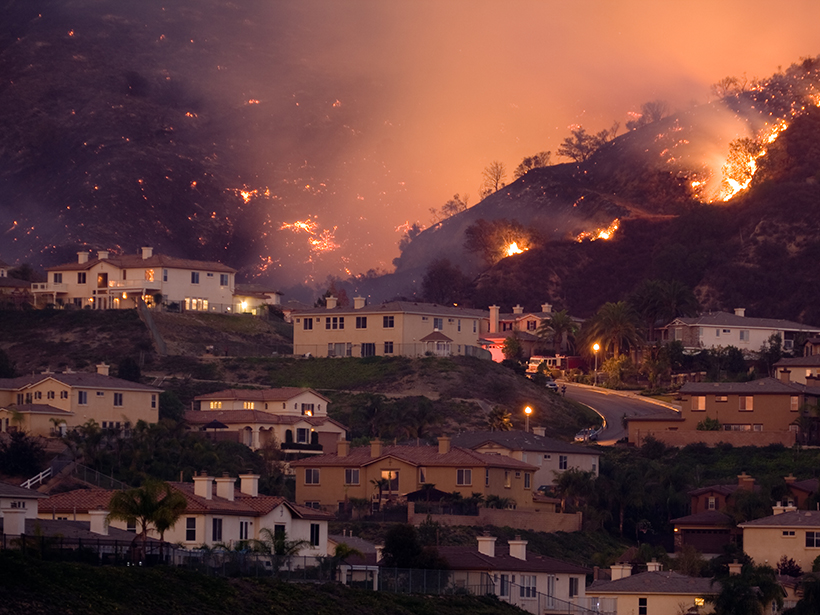
Homes and Other Buildings Abound in Natural Hazard Hot Spots
Researchers mined maps of natural hazards and land use to show that nearly 60% of structures are built in regions at high risk of earthquakes, wildfires, floods, hurricanes, and/or tornadoes.
Posted inNews
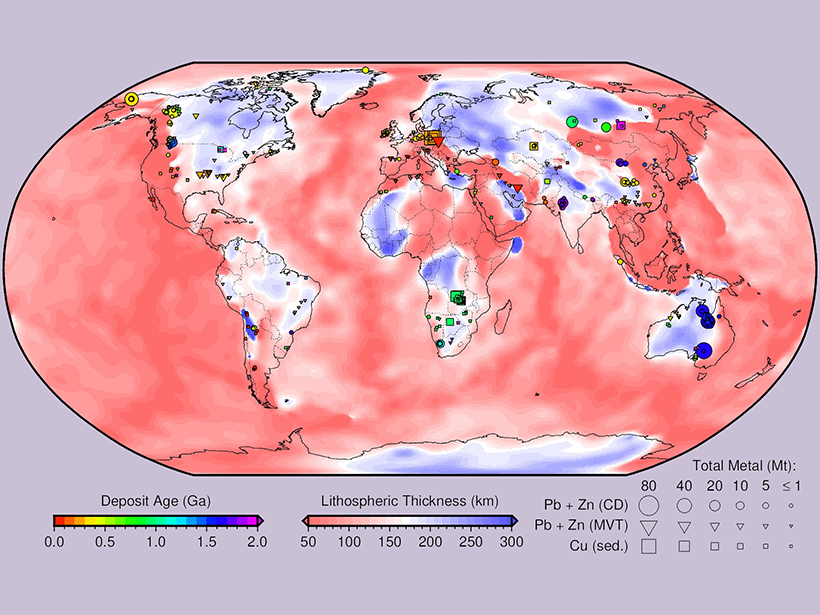
Cratons Mark the Spot for Mineral Bonanzas
A new map of the thickness of Earth’s lithosphere contains clues to large deposits of key metals.