• About
  • Sections
  • Topics
    • Climate
    • Earth Science
    • Oceans
    • Space & Planets
    • Health & Ecosystems
    • Culture & Policy
    • Education & Careers
    • Opinions
  • Projects
    • Postcards From the Field
    • ENGAGE
    • Editors’ Highlights
    • Editors’ Vox
    • Eos en Español
    • Eos 简体中文版
    • Print Archive: 2015–2025
  • Science Policy Tracker
  • Blogs
    • Research & Developments
    • The Landslide Blog
  • Newsletter
  • Submit to Eos
  • AGU.org
  • Career Center
  • Join AGU
  • Give to AGU
  • About
  • Sections
  • Topics
    • Climate
    • Earth Science
    • Oceans
    • Space & Planets
    • Health & Ecosystems
    • Culture & Policy
    • Education & Careers
    • Opinions
  • Projects
    • Postcards From the Field
    • ENGAGE
    • Editors’ Highlights
    • Editors’ Vox
    • Eos en Español
    • Eos 简体中文版
    • Print Archive: 2015–2025
  • Science Policy Tracker
  • Blogs
    • Research & Developments
    • The Landslide Blog
  • Newsletter
  • Submit to Eos
Skip to content
  • AGU.org
  • Career Center
  • Join AGU
  • Give to AGU
Eos

Eos

Science News by AGU

Support Eos
Sign Up for Newsletter
  • About
  • Sections
  • Topics
    • Climate
    • Earth Science
    • Oceans
    • Space & Planets
    • Health & Ecosystems
    • Culture & Policy
    • Education & Careers
    • Opinions
  • Projects
    • Postcards From the Field
    • ENGAGE
    • Editors’ Highlights
    • Editors’ Vox
    • Eos en Español
    • Eos 简体中文版
    • Print Archive: 2015–2025
  • Science Policy Tracker
  • Blogs
    • Research & Developments
    • The Landslide Blog
  • Newsletter
  • Submit to Eos

mapping

World maps showing estimated width and mean discharge of all mapped reaches
Posted inEditors' Highlights

Reconstructing Natural Streamflow at Unprecedented Resolution

by Marc F. P. Bierkens 3 September 201918 July 2025

A new research effort has mapped 35 years of naturalized streamflow for 2.94 million river reaches worldwide: an invaluable dataset for hydrology, biogeochemistry, ecology, and remote sensing.

Blue sea meeting red sands along Western Australia coast
Posted inNews

Australia’s Complex Intertidal Zones Mapped in 3-D

Kimberly M. S. Cartier, News Writing and Production Intern for Eos.org by Kimberly M. S. Cartier 2 August 20193 November 2021

Intertidal zones support biodiverse habitats but have lost serious ground in recent decades to development, erosion, and sea level rise.

Photo of a jetty and ocean beach
Posted inNews

Huge Aquifer Imaged off the Atlantic Coast

Mary Caperton Morton, Science Writer by Mary Caperton Morton 30 July 20193 November 2021

Offshore aquifers may be a common feature along passive continental margins around the world.

A visualization from space of rivers in Southeast and East Asia from a new global river map.
Posted inResearch Spotlights

A More Accurate Global River Map

by E. Underwood 12 July 201915 March 2023

A new map of global river systems is based on crowdsourcing and the latest topography data sets.

Photo of a research vessel in front of a tidewater glacier
Posted inResearch Spotlights

Arctic Glacial Retreat Alters Downstream Fjord Currents

Sarah Stanley, Science Writer by Sarah Stanley 14 June 201914 March 2024

High-resolution mapping efforts could improve predictions of coastal changes as glaciers shrink around the world.

A researcher inside the subglacial conduit under Hansbreen, Svalbard
Posted inResearch Spotlights

Mapping Subglacial Meltwater Channels

by E. Underwood 28 May 201923 January 2023

Researchers find that past studies underestimate the friction meltwater channels exert on glaciers by orders of magnitude.

Mekong River in Laos
Posted inNews

Where Did All the Free-Flowing Rivers Go?

Jenessa Duncombe, Staff Writer by Jenessa Duncombe 8 May 201927 April 2022

A map of the world’s free-flowing rivers shows a shrinking number can still meander as they please. New plans for hydropower will further constrain flow.

GPS station in southern Colorado
Posted inNews

Airborne Gravity Surveys Are Remaking Elevations in the U.S.

Jenessa Duncombe, Staff Writer by Jenessa Duncombe 6 May 20194 April 2023

Measuring gravity’s tiny fluctuations is giving the United States an upgraded system of elevations.

Meltwater flows in a canyon around 30 meters deep in Greenland.
Posted inResearch Spotlights

Mapping Ice Algal Blooms from Space

by E. Underwood 17 April 20196 July 2022

Satellite data reveal how colorful algae are melting the Greenland ice sheet.

High-resolution map of magnetic field variations in Minnesota showing details of the geology underlying glacial deposits.
Posted inScience Updates
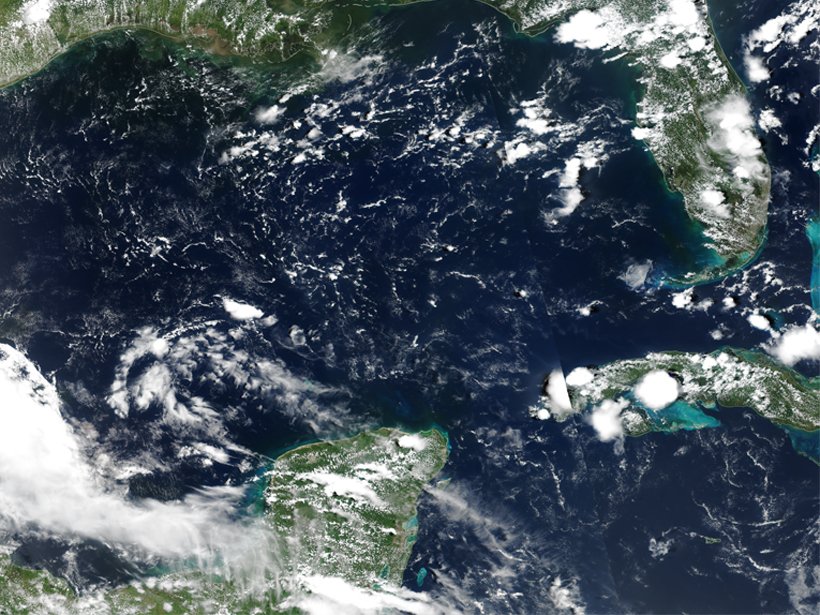
Finding the Gaps in America’s Magnetic Maps

by B. J. Drenth and V. J. S. Grauch 16 April 201930 September 2025

A 2017 executive order mandated a plan to evaluate U.S. access to critical mineral resources, but the airborne magnetic survey maps that support this effort are sadly out of date.

Posts pagination

Newer posts 1 … 13 14 15 16 17 … 23 Older posts
A view of a bridge, with the New Orleans skyline visible in the distance between the bridge and the water. A purple tint, a teal curved line representing a river, and the text “#AGU25 coverage from Eos” overlie the photo.

Features from AGU Publications

Research Spotlights

Denitrification Looks Different in Rivers Versus Streams

16 January 202616 January 2026
Editors' Highlights

ALMA’s New View of the Solar System

16 January 202616 January 2026
Editors' Vox

Bridging the Gap: Transforming Reliable Climate Data into Climate Policy

16 January 202616 January 2026
Eos logo at left; AGU logo at right

About Eos
ENGAGE
Awards
Contact

Advertise
Submit
Career Center
Sitemap

© 2026 American Geophysical Union. All rights reserved Powered by Newspack