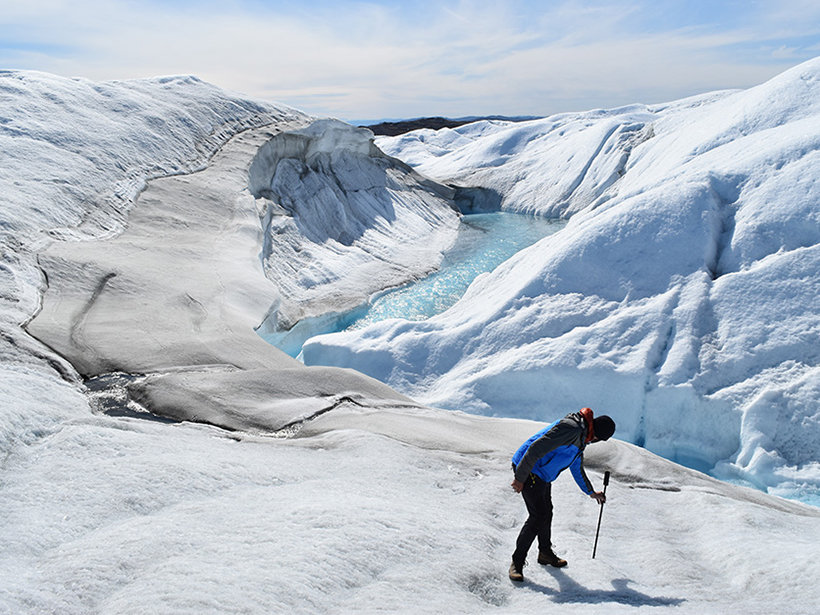
Satellite data reveal how colorful algae are melting the Greenland ice sheet.
mapping
Posted inScience Updates
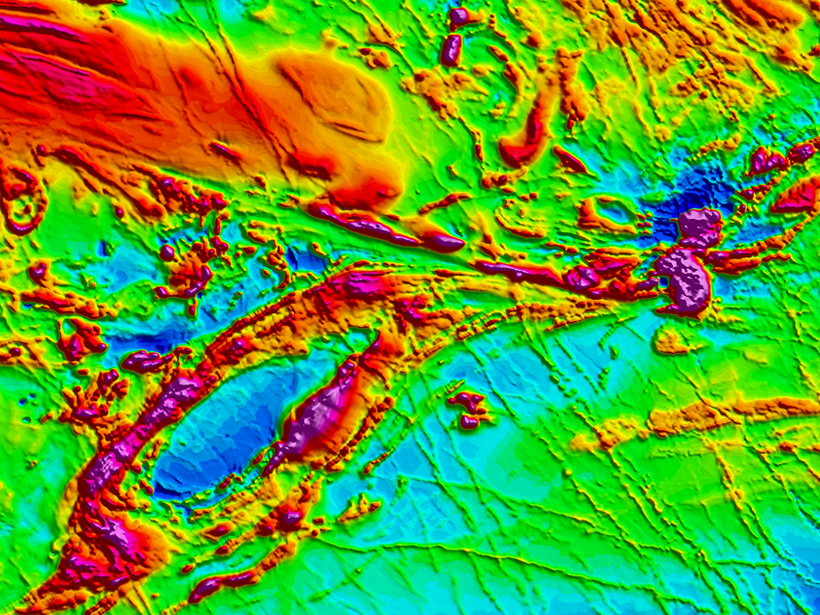
Finding the Gaps in America’s Magnetic Maps
A 2017 executive order mandated a plan to evaluate U.S. access to critical mineral resources, but the airborne magnetic survey maps that support this effort are sadly out of date.
Posted inNews
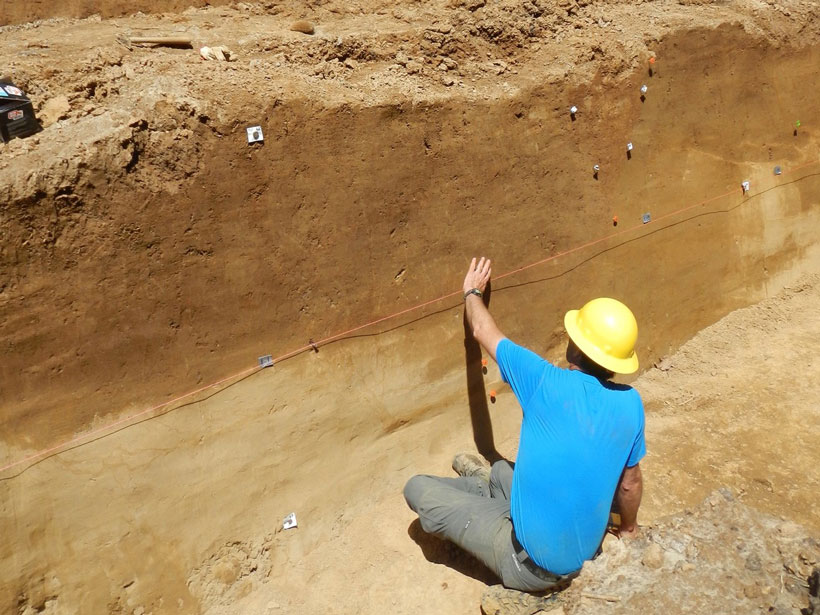
Secrets from the New Madrid Seismic Zone’s Quaking Past
High-resolution lidar topography reveals a long history of ancient earthquakes.

Posted inAGU News
Mapping Heat Vulnerability to Protect Community Health
Community leaders and scientists from two U.S. cities are combining public health data and heat maps to prepare residents for climate change–related health risks.
Posted inScience Updates
Making the First National Seafloor Habitat Map
Seamap Australia integrates seafloor maps with information on plant and animal habitats, environmental stressors, and resource management to create a first-of-its-kind resource.
Posted inNews
Kody Kramer (1985–2018)
His vision and persistence created a 1.4-billion-pixel map of the Gulf of Mexico seafloor—a crucial tool in research on the Deepwater Horizon oil spill and a completely new standard for bathymetry maps.

Posted inScience Updates
Scientists Invited to Collaborate in Satellite Mission’s Debut
The Surface Water and Ocean Topography mission will begin by scanning Earth’s surface once a day. We invite ocean scientists to contribute ground-based measurements to compare with the satellite data.
Posted inEditors' Highlights
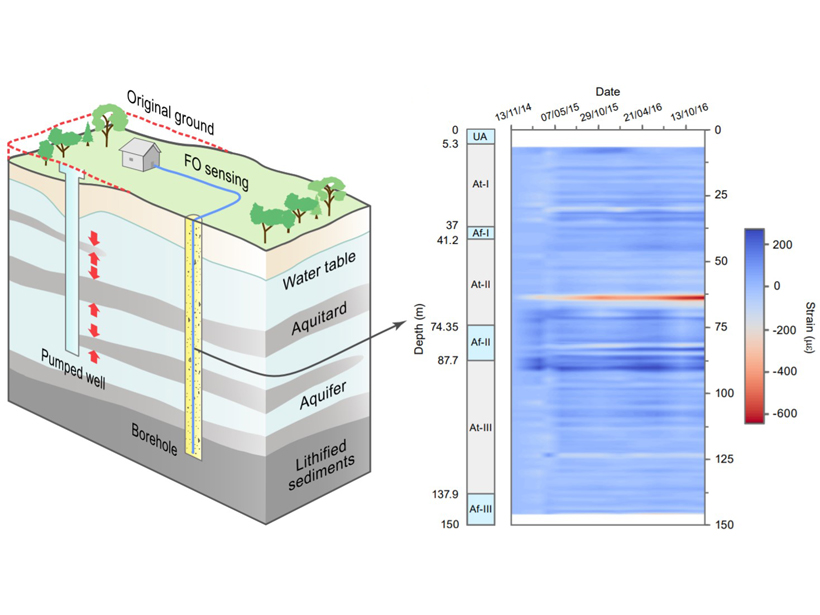
Fiber Optics Opens Window into Subsurface Deformation
The distributed deformation of buried materials is difficult to map, but a new approach is able to resolve vertical deformation over the length of a fiber optic cable.

Posted inResearch Spotlights
A More Detailed Look at Earth’s Most Poorly Understood Crust
The second-generation Antarctic Digital Magnetic Anomaly Project offers a powerful new tool for probing the structure and evolution of the southernmost continent’s lithosphere.