
A new online resource from the National Oceanic and Atmospheric Administration provides an interactive view of global satellite ocean color and true-color imagery.
mapping
Posted inNews
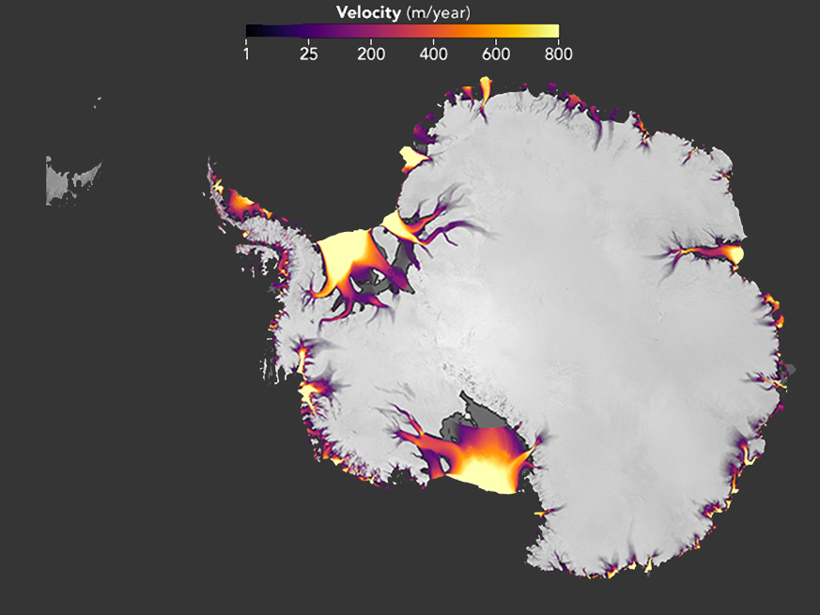
New Maps Highlight Antarctica’s Flowing Ice
The maps focus on surface ice velocity, showing how Antarctica’s frozen surface changed over a 7-year period.

Posted inNews
Ozone Pollution Maps Show Spikes Amid Broad Declines
Exceptionally comprehensive new maps detail current global concentrations and 15-year trends.

Posted inEditors' Highlights
Ocean Wind Satellites Observe an Amazonian Drought
Satellites designed to observe ocean winds can also be used to map both forest structure and water content, allowing researchers to disentangle factors of carbon loss due to drought in the Amazon.
Posted inNews
Report Recommends Priorities for Earth Observations from Space
The new strategic plan, which builds on earlier road maps for observing the planet, identifies top targets for satellite scrutiny for the next decade.
Posted inEditors' Highlights
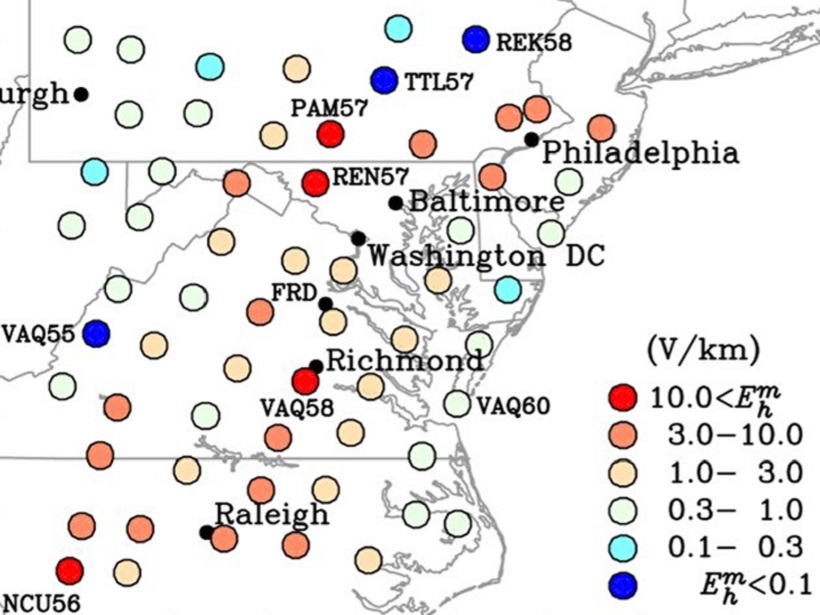
Mapping Extreme-Value Geoelectric Fields
To help mitigate magnetic storm interference on electric power grid operations, extreme-value geoelectric fields have been mapped across the mid-Atlantic United States.
Posted inResearch Spotlights
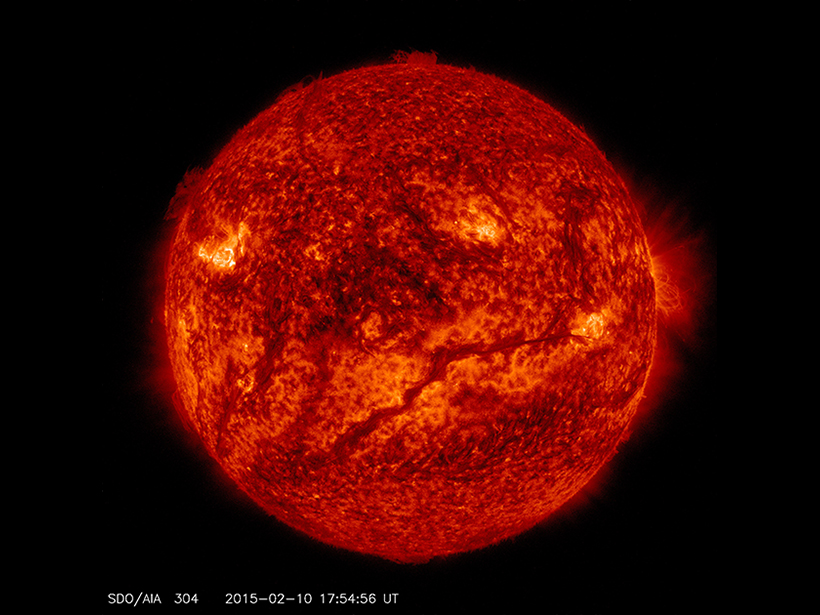
Preserving a 45-Year Record of Sunspots
Maps reveal how the Sun’s magnetic field evolves through solar cycles.
Posted inNews
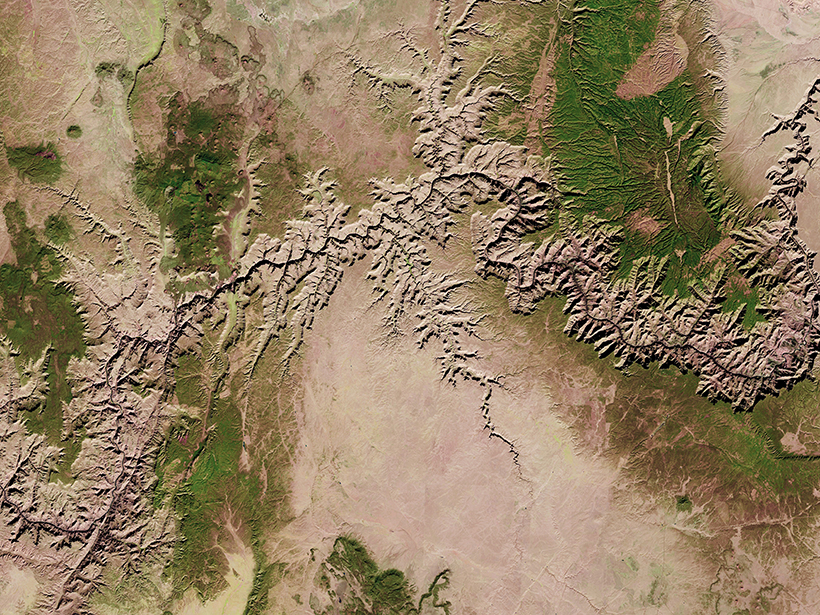
Map Provides High-Resolution Look at Nearly Entire Arctic Region
Researchers highlight the value of the time element incorporated into imagery and having a baseline for revisiting and comparing topography.

Posted inNews
Geologic Map of Europa Highlights Targets for Future Exploration
The first such map of the icy moon puts its strange surface features into perspective.
Posted inResearch Spotlights
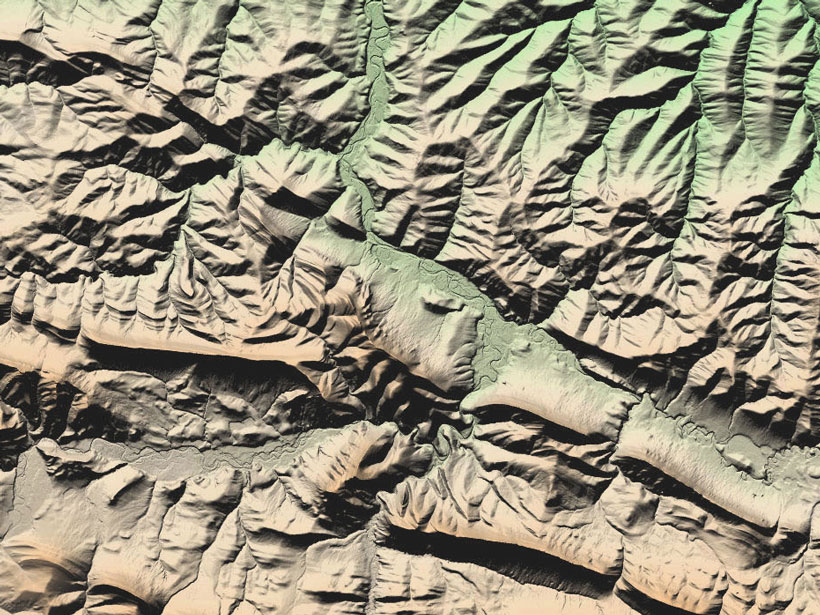
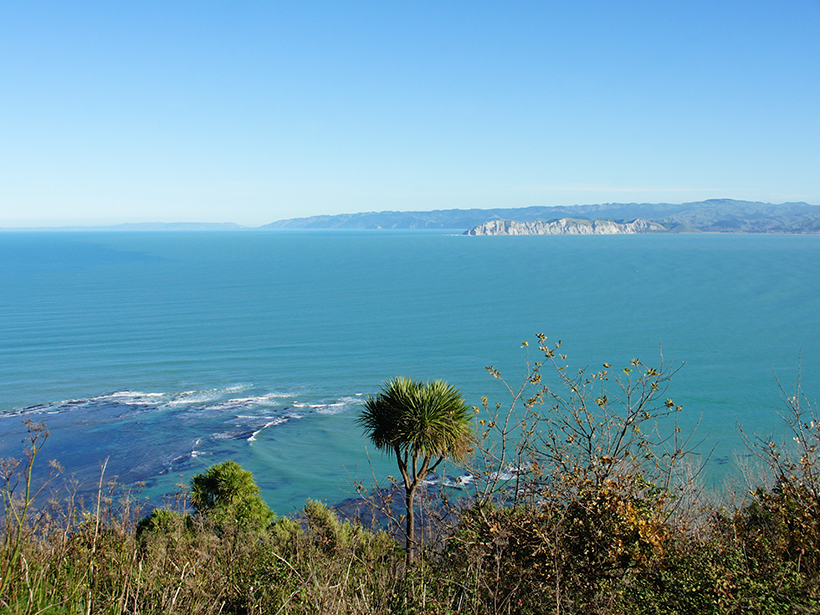
Imaging the Underlying Mechanics of New Zealand Earthquakes
Researchers create a first-of-its-kind image to map electrical properties of rocks and minerals throughout the Hikurangi subduction zone.