From tiny seafloor features in the Gulf of Mexico to craters pocking the surface of Mars, the details on these maps captivate and fascinate.
mapping
Posted inScience Updates
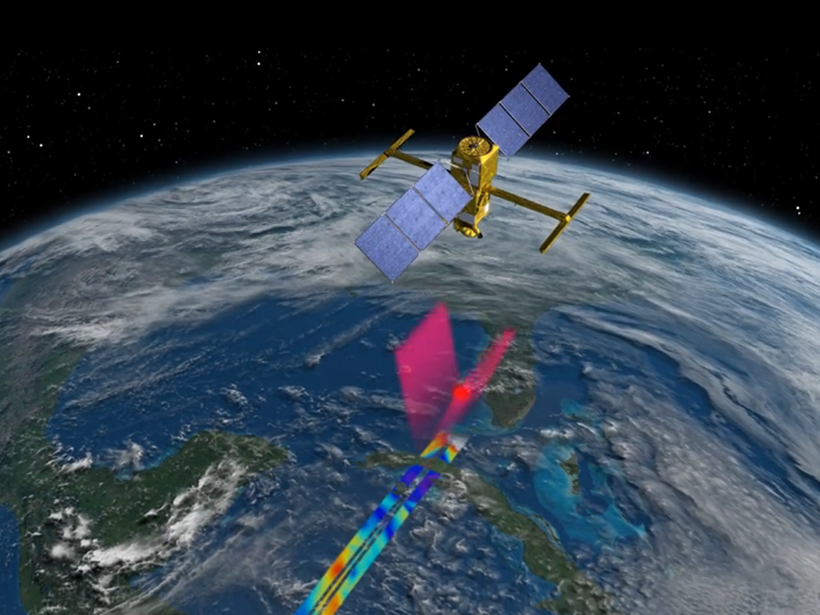
Putting Satellite Maps of Surface Water to Practical Use
2nd SWOT Application User Workshop: Engaging the User Community for Advancing Societal Applications of the Surface Water Ocean Topography (SWOT) Mission, Reston, Virginia, 5–6 April 2017
Posted inScience Updates
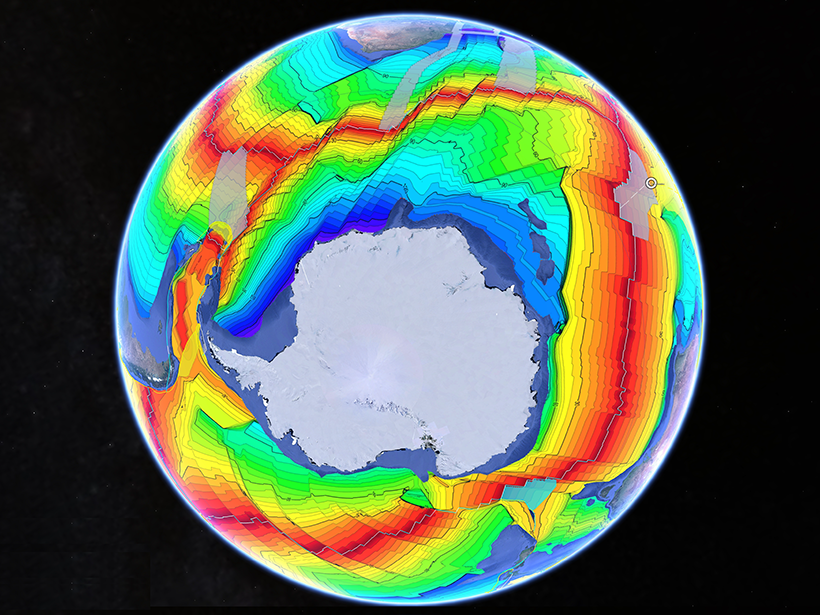
A Grand Tour of the Ocean Basins
A new teaching resource facilitates plate tectonic studies using a Google Earth virtual guided tour of ocean basins around the world.
Posted inNews
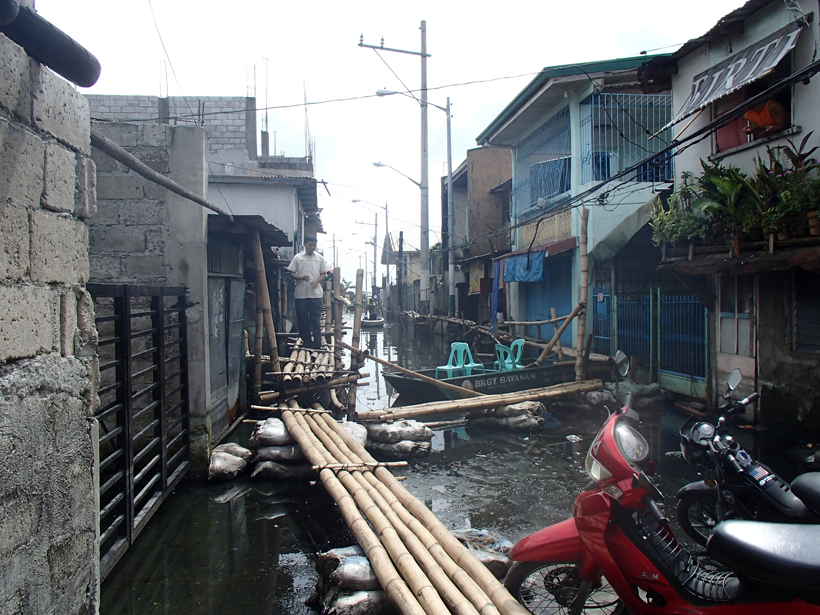
Mapping Dengue Fever Hazard with Machine Learning
Researchers develop a predictive software system to identify city-specific, dengue fever risk areas amid a global increase in cases.

Posted inScience Updates
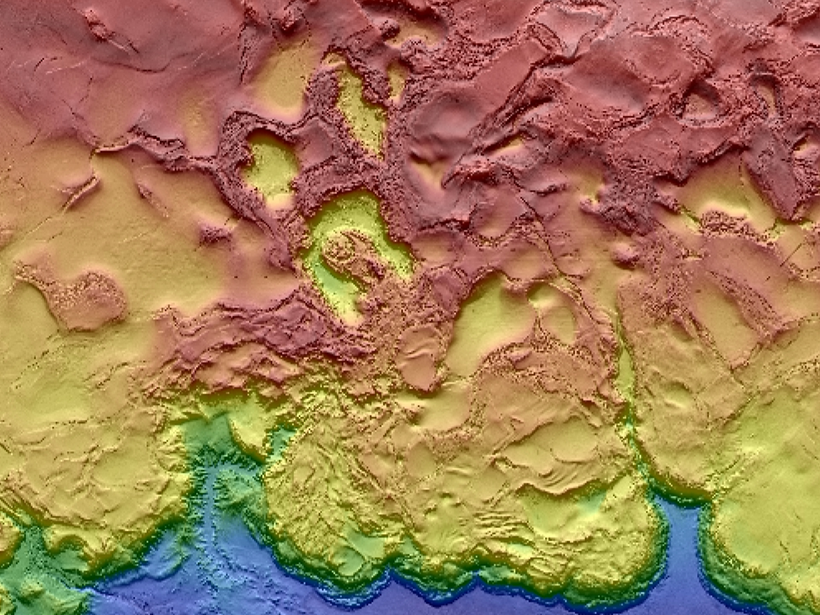
A 1.4-Billion-Pixel Map of the Gulf of Mexico Seafloor
The U.S. Bureau of Ocean Energy Management releases the highest-resolution bathymetry map of the region to date.

Posted inResearch Spotlights
Cosmic Muons Reveal the Land Hidden Under Ice
Scientists accurately map the shape of the bedrock beneath a glacier using a new technique.
Posted inScience Updates
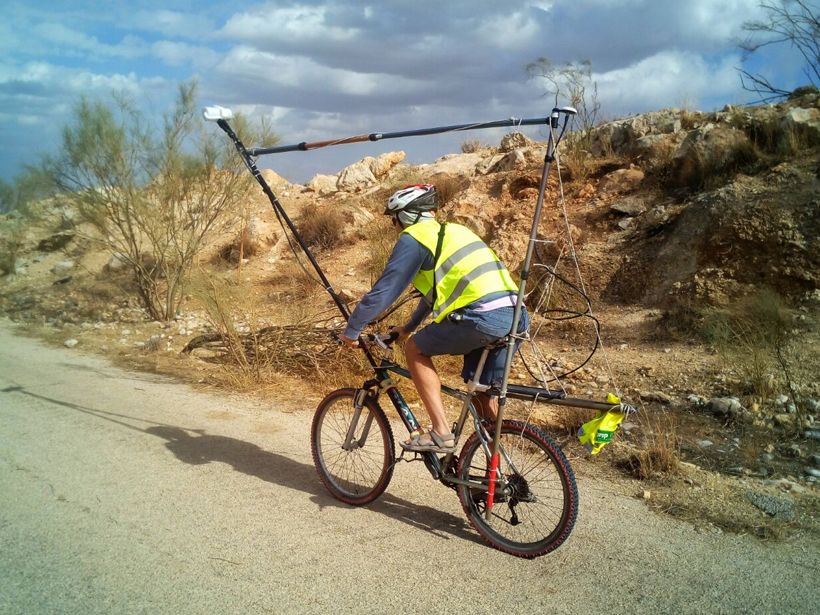
A Bike Built for Magnetic Mapping
Mounting a magnetic sensor on a bicycle offers an efficient, low-cost method of collecting ground magnetic field data over rough terrain where conventional vehicles dare not venture.

Posted inNews
What to Expect from Cassini's Final Views of Titan
Cassini will fly close to Saturn's largest moon one last time. Here's a look back at what the spacecraft has revealed and ahead to scientists' final close glimpses of the moon.
Posted inResearch Spotlights
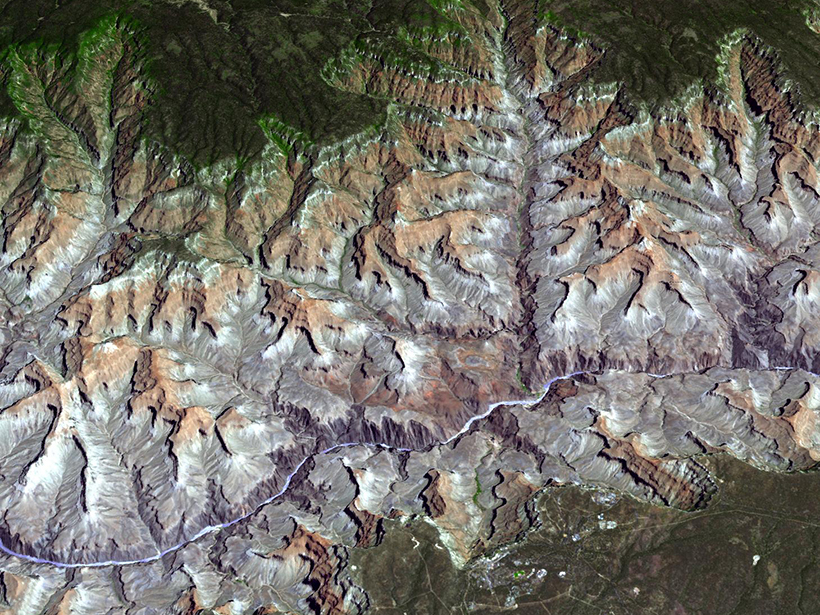
Stream Network Geometry Correlates with Climate
A "big data" analysis of nearly 1 million river junctions in the contiguous United States shows that branching angles in dendritic drainages vary systematically between humid and arid regions.

Posted inResearch Spotlights
Sun Glitter Provides a Detailed Map of Ocean Waves
European scientists use satellite sensors to detect light reflected off waves at the ocean's surface, which could help improve wave forecasts.