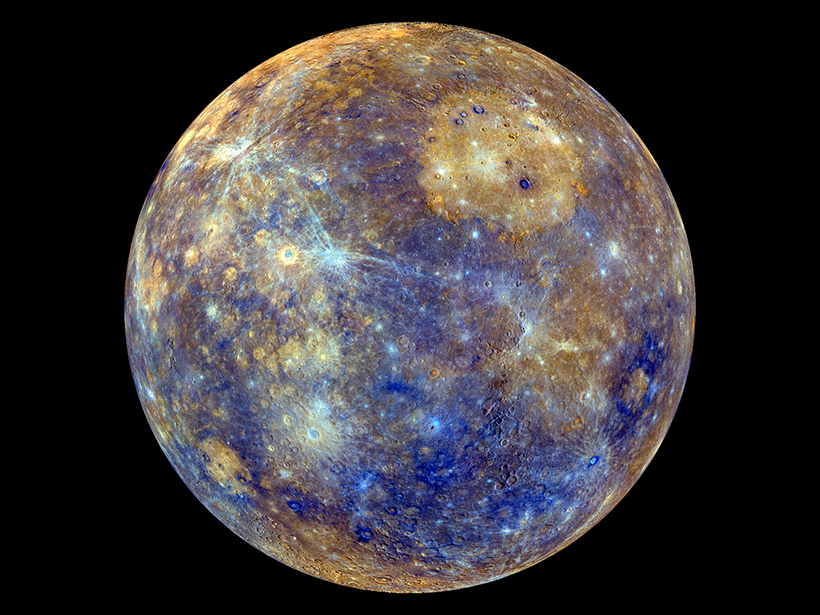
BepiColombo may launch as early as this weekend. It seeks to unravel the mysteries of Mercury’s geologic and magnetic past and map the small planet’s cratered surface.
mapping

Posted inNews
Lidar Uncovers Thousands of New Maya Structures
Jungle-piercing lidar surveys over ancient Maya sites give scientists the most extensive maps of lowland Maya civilization to date.
Posted inScience Updates
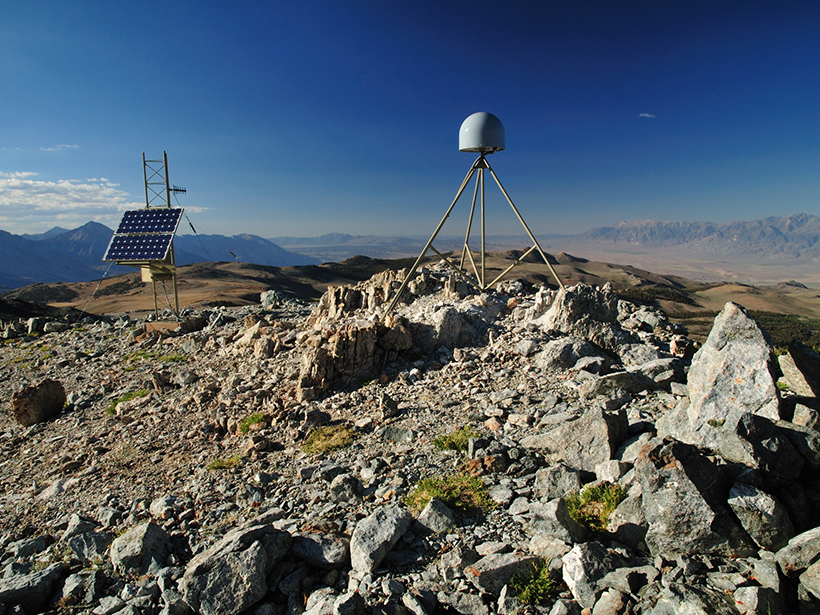
Harnessing the GPS Data Explosion for Interdisciplinary Science
More GPS stations, faster data delivery, and better data processing provide an abundance of information for all kinds of Earth scientists.

Posted inNews
How Hot Is Europa? Now There’s a Map for That
The new global map of Europa’s surface heat also highlighted one spot on the moon that is inexplicably cold.
Posted inScience Updates
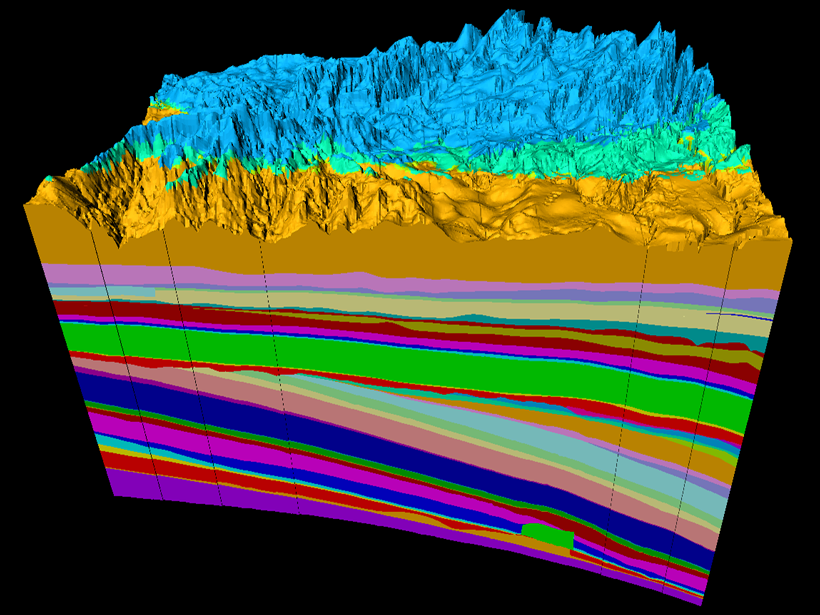
Geology in 3-D and the Evolving Future of Earth Science
Geologic Mapping Forum; Minneapolis, Minnesota, 26–29 March 2018
Posted inScience Updates
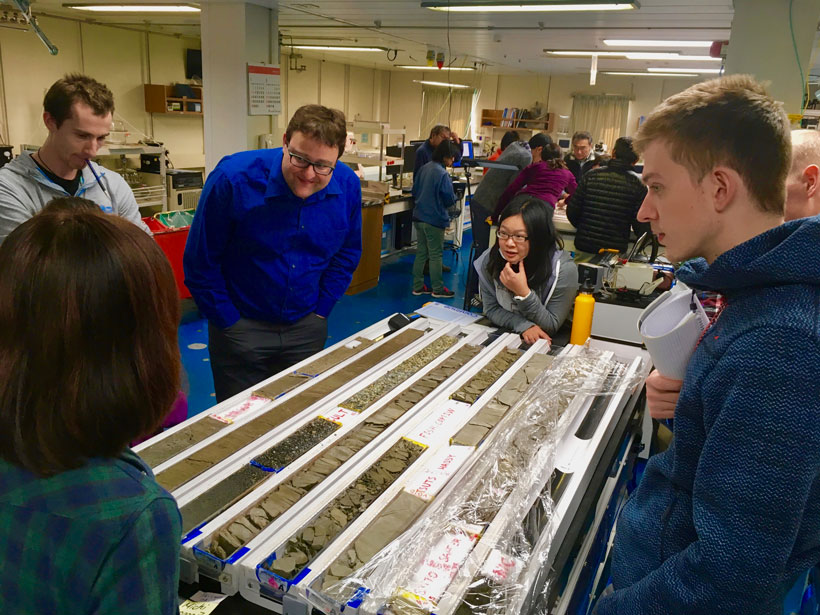
At-Sea Workshop Advances Subduction Zone Research
International Ocean Discovery Program Core-Log-Seismic integration at Sea (CLSI@Sea) workshop; Nankai Trough, Philippine Sea, off the coast of southwest Japan, January–February 2018

Posted inEditors' Vox
The Challenges of Global Flood Hazard Mapping and Prediction
A new book presents the latest tools in remote sensing technologies and modeling approaches for addressing challenges and meeting future needs in global flood hazard mapping and prediction.
Posted inScience Updates
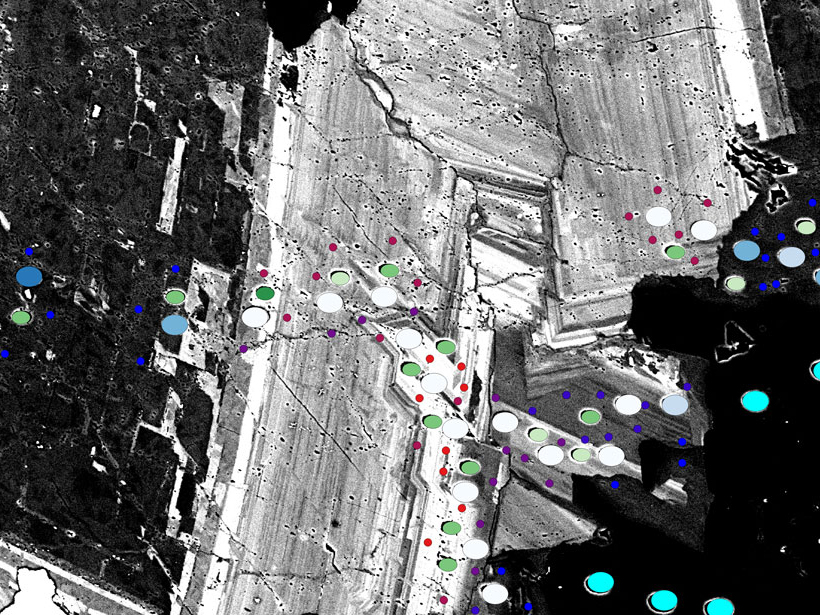
Making Maps on a Micrometer Scale
Geographic information system software, created for mapping cities and continents, works equally well with the minuscule layers and inclusions that record a crystal’s history.
Posted inResearch Spotlights
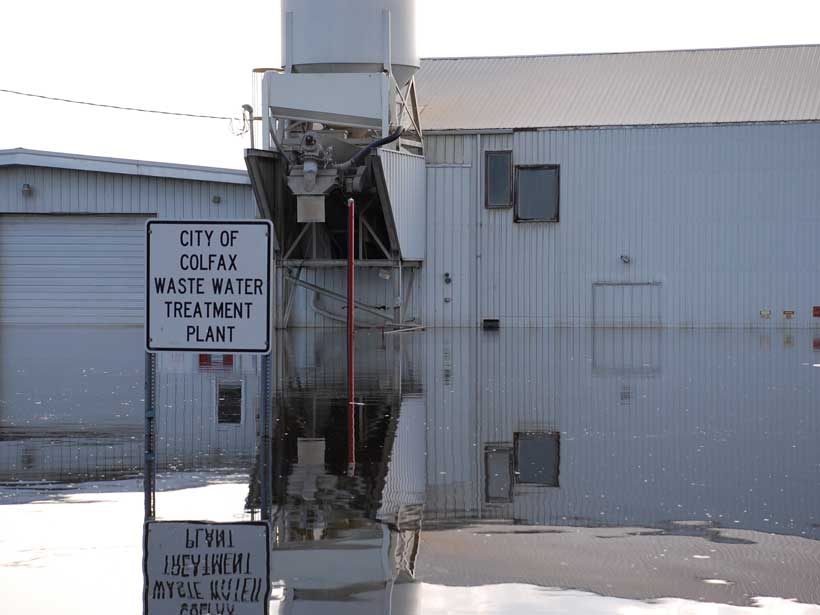
Sea Level Rise Threatens Hundreds of Wastewater Treatment Plants
Untreated sewage could affect 5 times more people than direct flooding, a new study shows.

Posted inScience Updates
Interactive Online Maps Make Satellite Ocean Data Accessible
A new online resource from the National Oceanic and Atmospheric Administration provides an interactive view of global satellite ocean color and true-color imagery.