
Insights from a new study could spark discoveries about Martian landscapes and also help researchers get to the bottom of canyon formation here on Earth.
mapping

Posted inNews
Podcast: Plate Tectonics, the Theory That Changed Earth Science
Third Pod from the Sun talks with pioneering geophysicist Xavier Le Pichon about what it was like to be a young scientist challenging deeply held theories.
Posted inEditors' Highlights
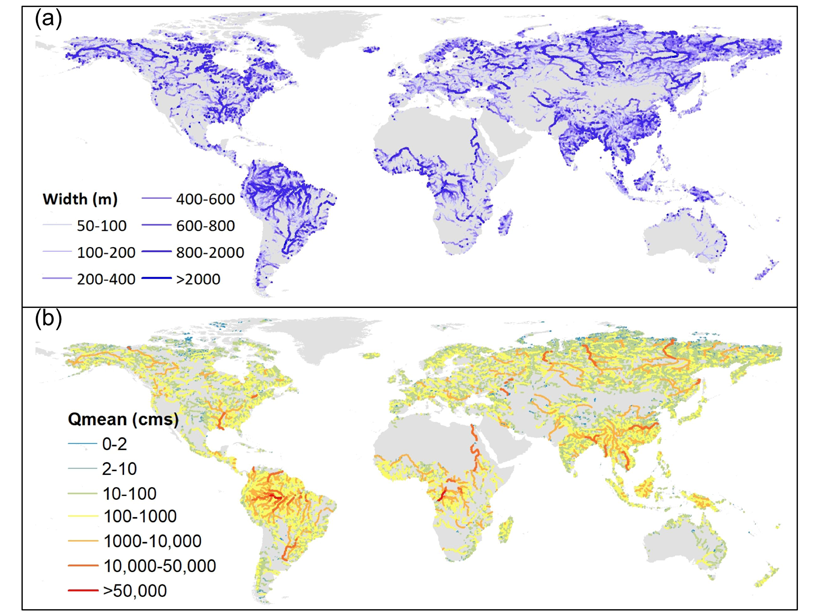
Reconstructing Natural Streamflow at Unprecedented Resolution
A new research effort has mapped 35 years of naturalized streamflow for 2.94 million river reaches worldwide: an invaluable dataset for hydrology, biogeochemistry, ecology, and remote sensing.
Posted inNews
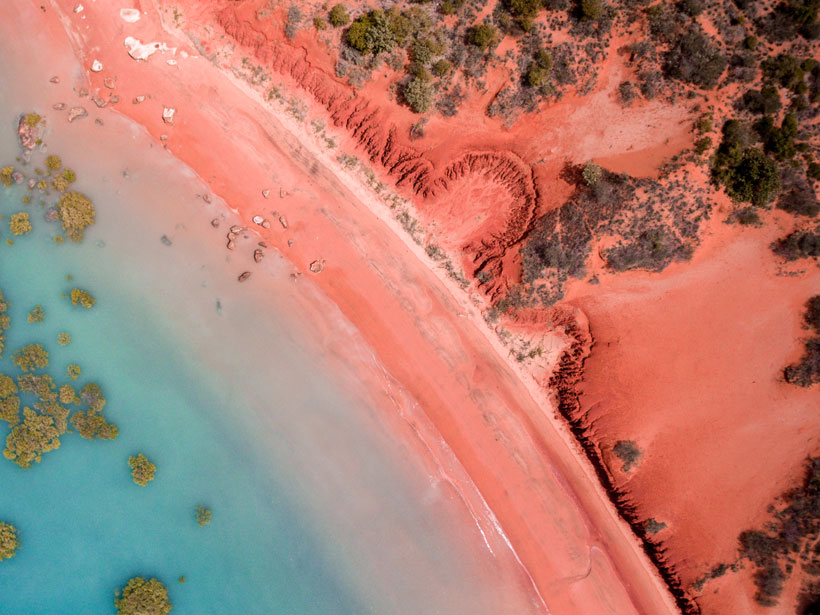
Australia’s Complex Intertidal Zones Mapped in 3-D
Intertidal zones support biodiverse habitats but have lost serious ground in recent decades to development, erosion, and sea level rise.
Posted inNews
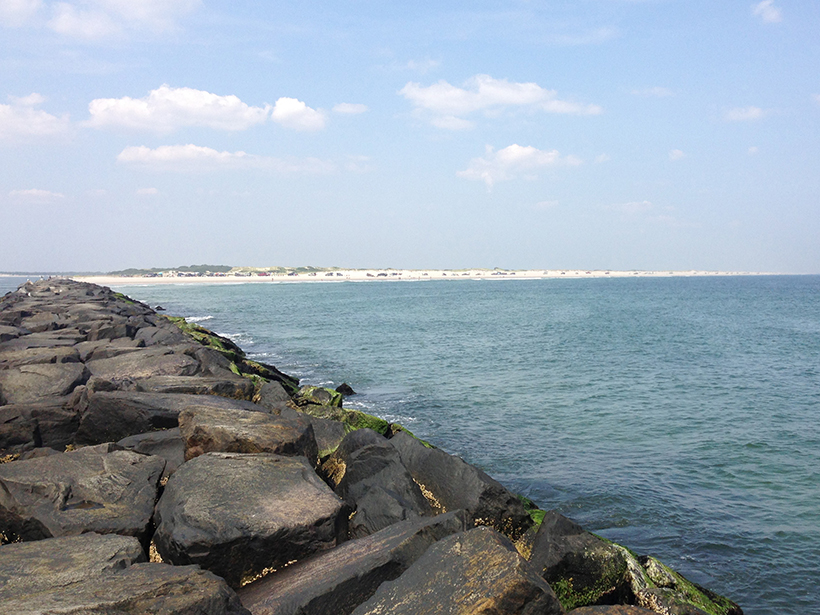
Huge Aquifer Imaged off the Atlantic Coast
Offshore aquifers may be a common feature along passive continental margins around the world.
Posted inResearch Spotlights
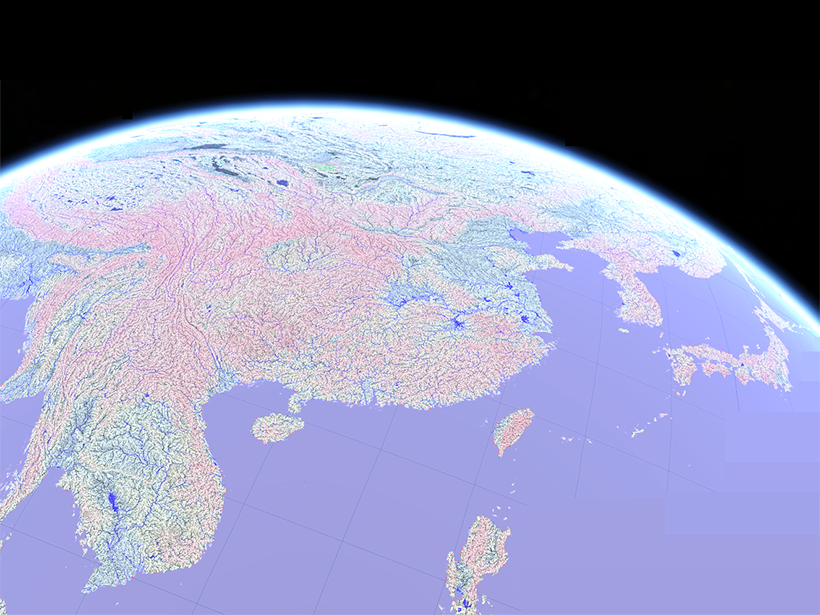
A More Accurate Global River Map
A new map of global river systems is based on crowdsourcing and the latest topography data sets.
Posted inResearch Spotlights
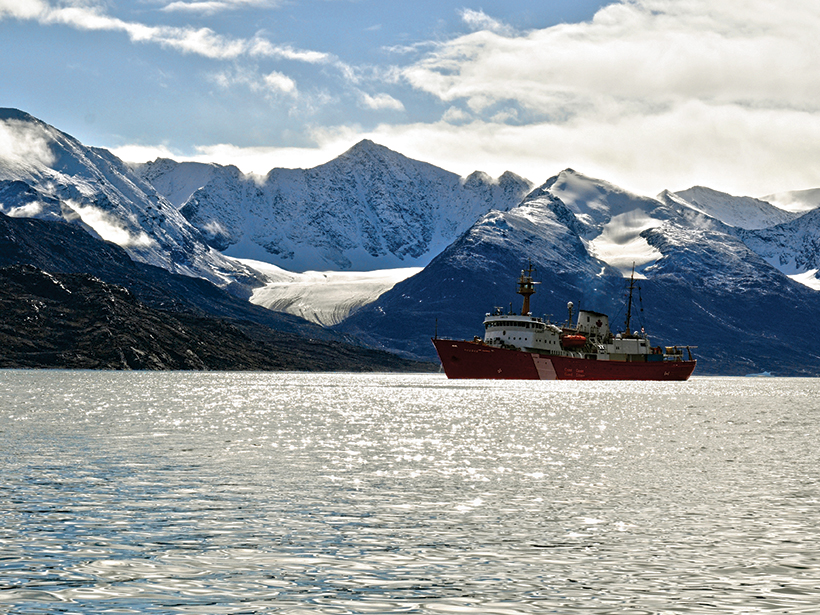
Arctic Glacial Retreat Alters Downstream Fjord Currents
High-resolution mapping efforts could improve predictions of coastal changes as glaciers shrink around the world.
Posted inResearch Spotlights
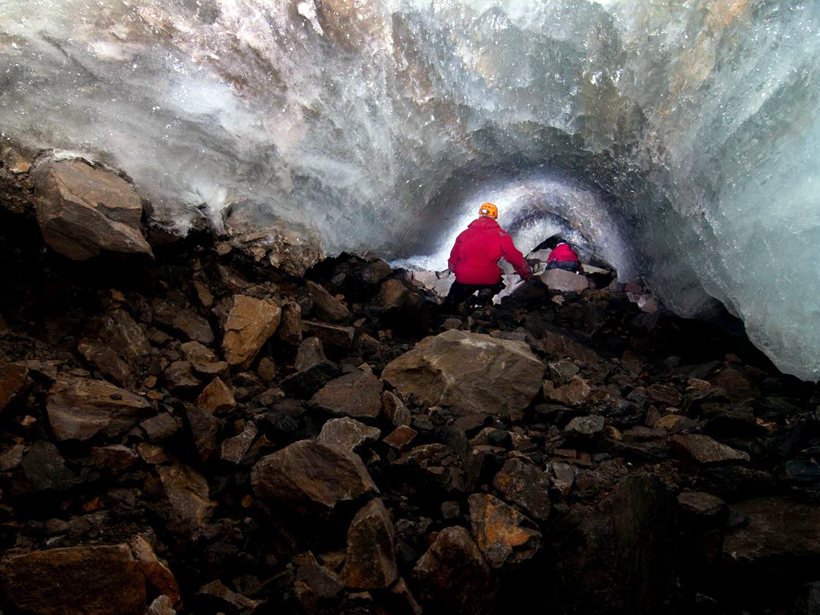
Mapping Subglacial Meltwater Channels
Researchers find that past studies underestimate the friction meltwater channels exert on glaciers by orders of magnitude.
Posted inNews
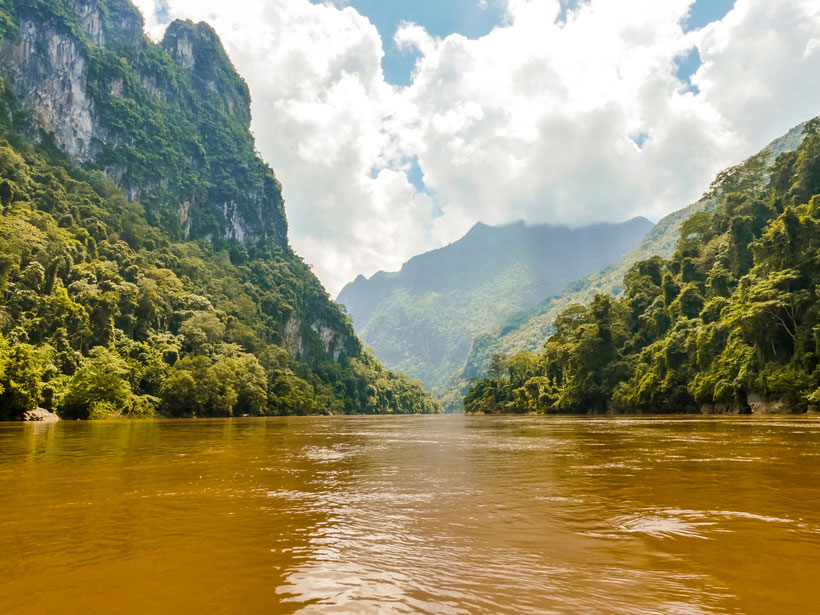
Where Did All the Free-Flowing Rivers Go?
A map of the world’s free-flowing rivers shows a shrinking number can still meander as they please. New plans for hydropower will further constrain flow.
Posted inNews
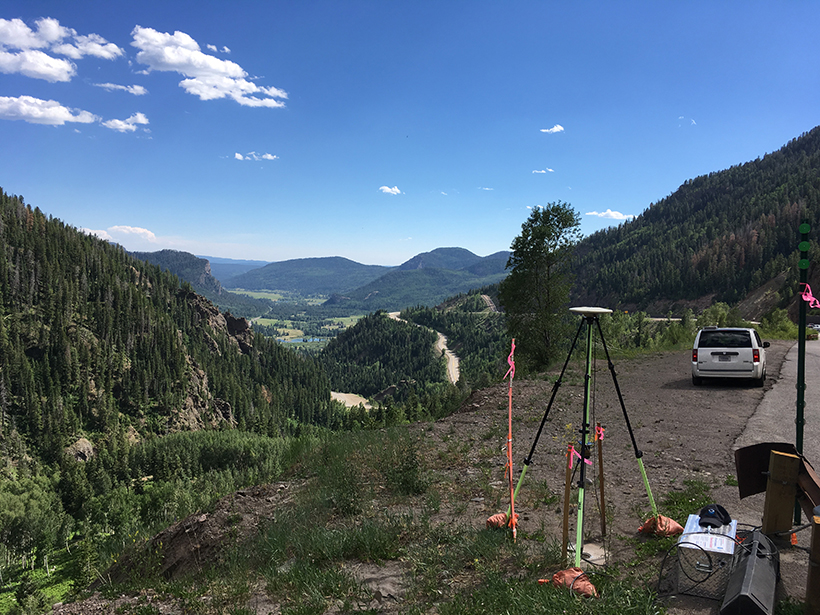
Airborne Gravity Surveys Are Remaking Elevations in the U.S.
Measuring gravity’s tiny fluctuations is giving the United States an upgraded system of elevations.