
Researchers used both aerial and satellite imagery, as well as machine learning, to map the carbon stock of every overstory tree in Rwanda—the first such inventory in the world.
mapping
Posted inNews
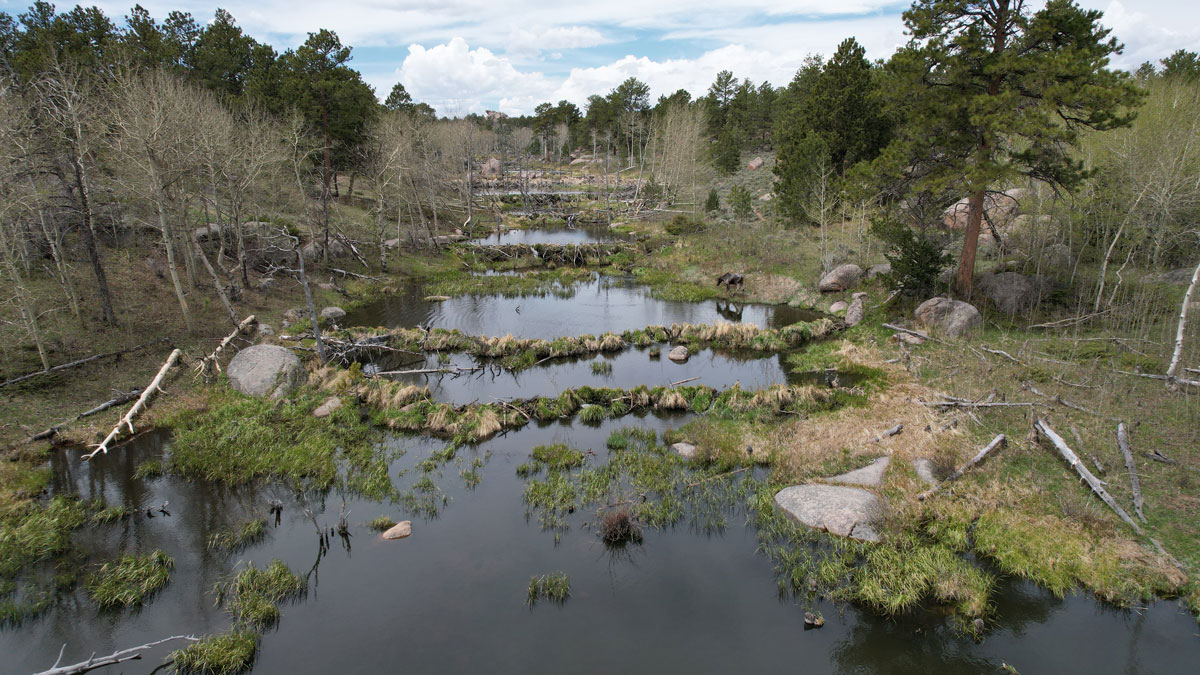
Scientists EEAGER-ly Track Beavers Across Western United States
Efficiently tracking nature’s engineers—beavers—at the scale of entire watersheds over time is now possible, thanks to a new artificial intelligence–trained model called EEAGER.

Posted inResearch Spotlights
Mapeando estimaciones de la contaminación a nivel de calle para encontrar rutas más seguras
Un nuevo enfoque de alta resolución que combina múltiples tipos de datos detección remota de la contaminación permitió a investigadores desarrollar una aplicación que mapea las rutas más saludables para los transeúntes urbanos.

Posted inResearch Spotlights
Long-Lived Lakes Reveal a History of Water on Mars
High-resolution imagery of newly discovered paleolakes shows a period of consistent liquid water flow.
Posted inResearch Spotlights
通过街道污染估计图选择更健康的通行路线
研究人员采用一种新的高分辨率方法结合多种类型的遥感污染数据,开发出一款应用程序,可为城市通勤者绘制最健康的路线。

Posted inResearch Spotlights
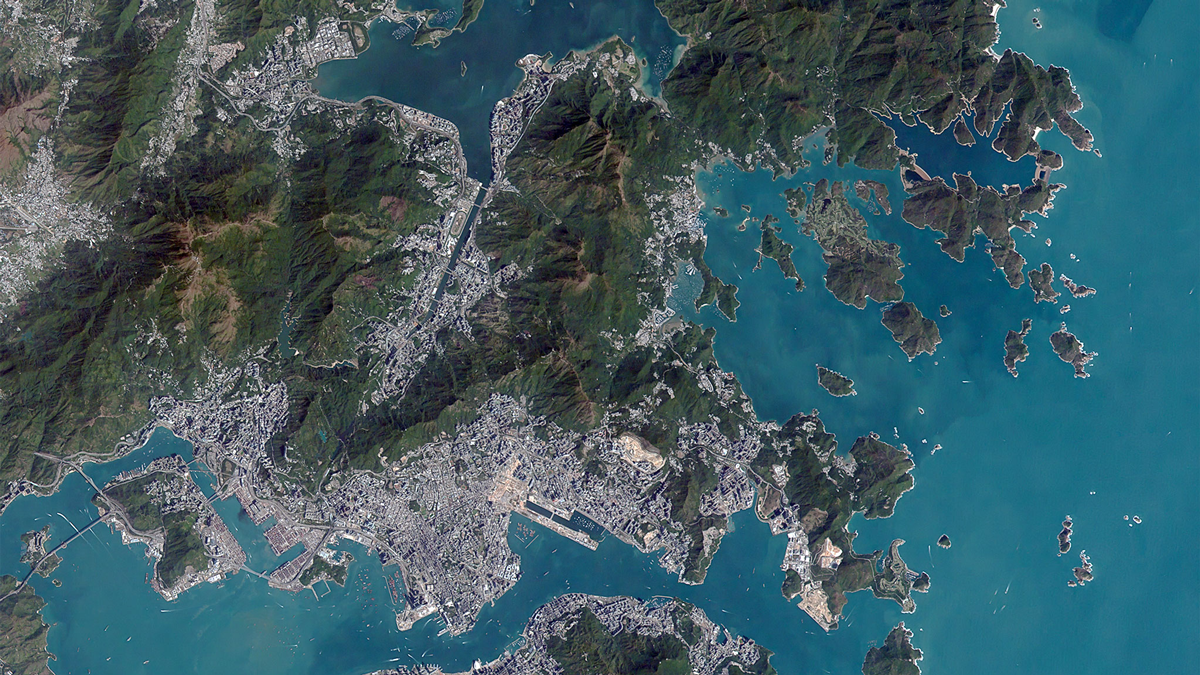
Mapping Street-Level Pollution Estimates to Reveal Safer Routes
A new high-resolution approach combining multiple types of remotely sensed pollution data allowed researchers to develop an app that maps the healthiest routes for urban commuters.
Posted inNews
Geospatial Database for the Prince Edward Islands
South African scientists map uninhabited islands in the Southern Ocean.
Posted inNews
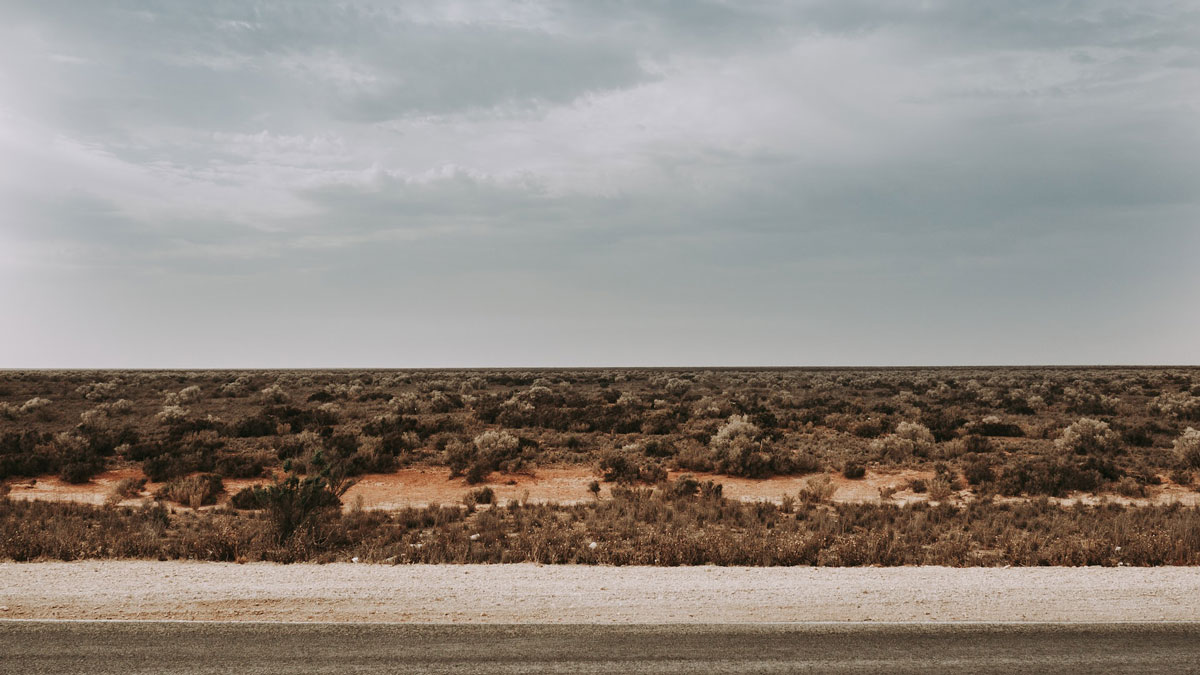
A Mysterious Dome Reveals Clues to Australia’s Miocene History
The Nullarbor Plain has been relatively untouched by geological forces, leaving traces of the continent’s deep past.

Posted inNews
Tracking Climate Through Ship Exhaust
International regulations have reduced aerosol pollutants released from ships. Now, researchers want to use ship tracks to better understand the ambiguous effects that cleaner air has on climate.

Posted inResearch Spotlights
New Map of Proposed Mantle-Driven Topography Stirs the Pot
The role the deep Earth plays in creating topography is hotly debated. A new study uses subtle elevation changes around the globe as evidence that the mantle plays a key role in building topography.