• About
  • Special Reports
  • Topics
    • Climate
    • Earth Science
    • Oceans
    • Space & Planets
    • Health & Ecosystems
    • Culture & Policy
    • Education & Careers
    • Opinions
  • Projects
    • Postcards From the Field
    • ENGAGE
    • Editors’ Highlights
    • Editors’ Vox
    • Eos en Español
    • Eos 简体中文版
    • Print Archive: 2015–2025
  • Policy Tracker
  • Blogs
    • Research & Developments
    • The Landslide Blog
  • Newsletter
  • Submit to Eos
  • AGU.org
  • Career Center
  • Join AGU
  • Give to AGU
  • About
  • Special Reports
  • Topics
    • Climate
    • Earth Science
    • Oceans
    • Space & Planets
    • Health & Ecosystems
    • Culture & Policy
    • Education & Careers
    • Opinions
  • Projects
    • Postcards From the Field
    • ENGAGE
    • Editors’ Highlights
    • Editors’ Vox
    • Eos en Español
    • Eos 简体中文版
    • Print Archive: 2015–2025
  • Policy Tracker
  • Blogs
    • Research & Developments
    • The Landslide Blog
  • Newsletter
  • Submit to Eos
Skip to content
  • AGU.org
  • Career Center
  • Join AGU
  • Give to AGU
Eos

Eos

Science News by AGU

Support Eos
Sign Up for Newsletter
  • About
  • Special Reports
  • Topics
    • Climate
    • Earth Science
    • Oceans
    • Space & Planets
    • Health & Ecosystems
    • Culture & Policy
    • Education & Careers
    • Opinions
  • Projects
    • Postcards From the Field
    • ENGAGE
    • Editors’ Highlights
    • Editors’ Vox
    • Eos en Español
    • Eos 简体中文版
    • Print Archive: 2015–2025
  • Policy Tracker
  • Blogs
    • Research & Developments
    • The Landslide Blog
  • Newsletter
  • Submit to Eos

Modeling

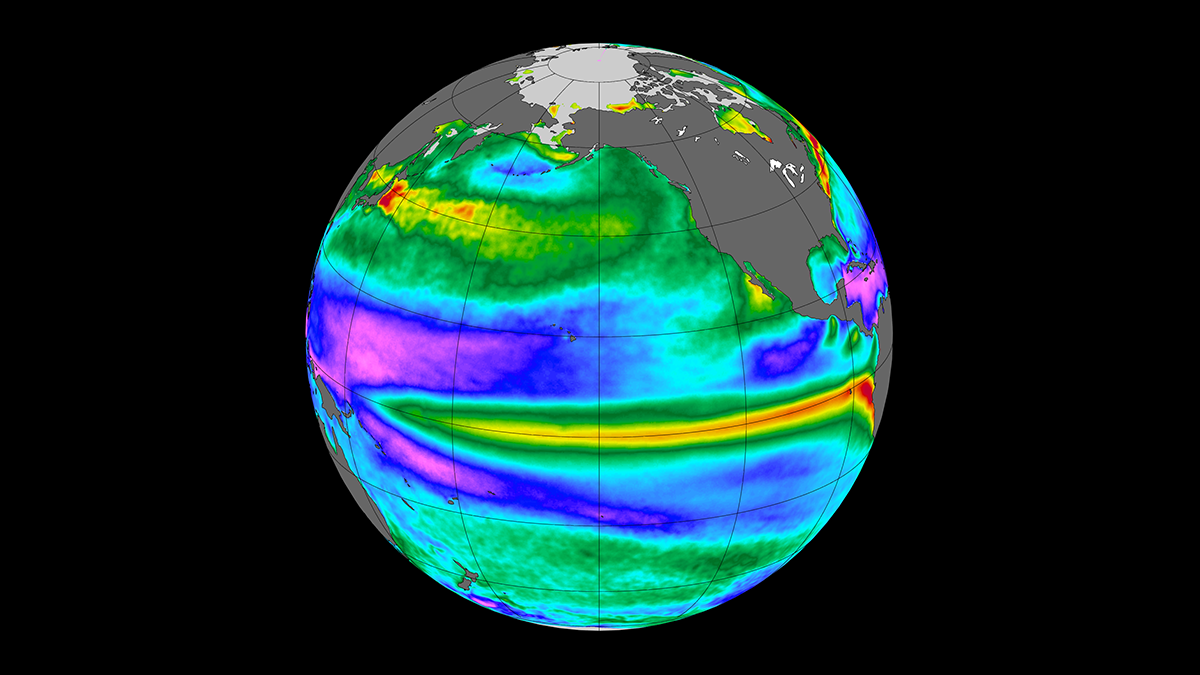
Data from the J-OFURO3 satellite product showing monthly sea surface temperature variations across the global ocean. The red colors indicate sea surface temperature swings from month to month that are typically larger than 1.5°C, while dark blues and purples indicate variations that are typically smaller than 0.5°C.
Posted inResearch Spotlights

Spatial Scale Shapes the Ocean and Atmosphere’s Influence on the Climate

Aaron Sidder, freelance science writer by Aaron Sidder 9 August 20229 August 2022

Researchers measured the processes driving heat exchange between the Pacific Ocean and the atmosphere.

A person lowering their head with the setting Sun in the background
Posted inResearch Spotlights

The Effects of Climate Change on U.S. Suicide Rates

by Alexandra K. Scammell 5 August 202214 September 2022

Suicide incidence could increase by up to 1,660 cases annually, depending on how much the climate changes.
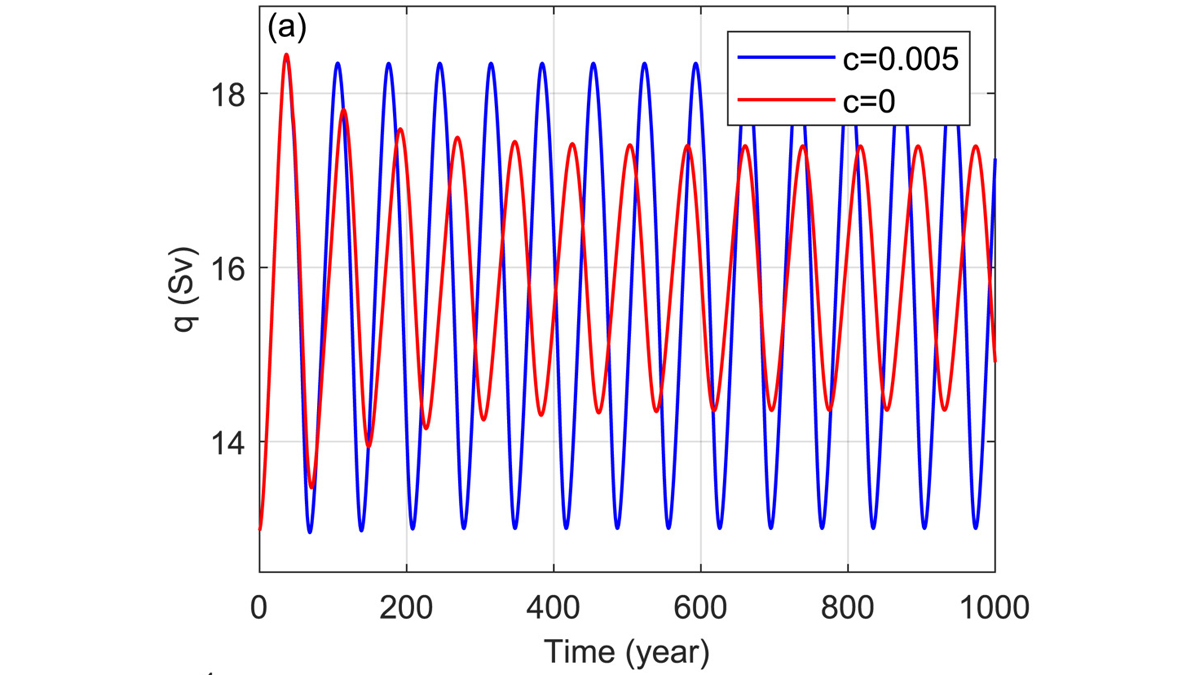
Graph from the paper.
Posted inEditors' Highlights

Arctic Salinity Pushes the AMOC Swing

by Kristopher B. Karnauskas 3 August 20222 July 2024

A model of the Atlantic Meridional Overturning Circulation (AMOC), pioneered by Henry Stommel over 60 years ago, can exhibit realistic cyclic behavior if the role of Arctic salinity is included.

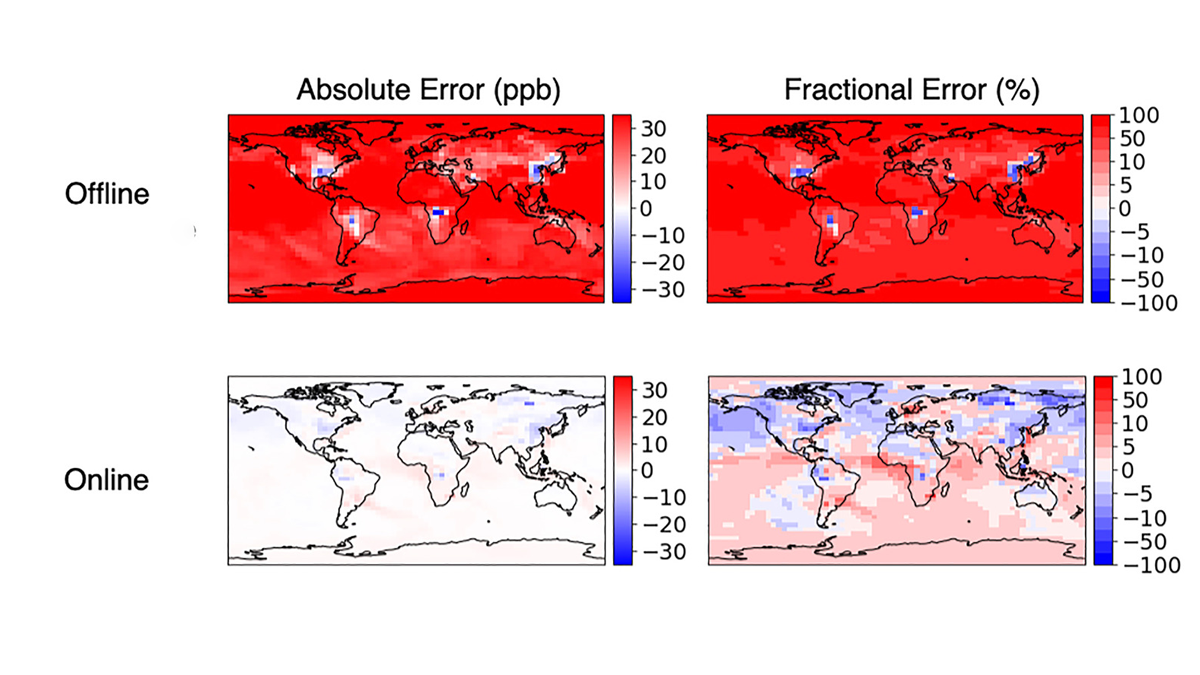
Graphs showing the vertical profiles of the error in shortwave downwelling flux, upwelling flux, and heating rates computed from fluxes.
Posted inEditors' Highlights

Machine Learning Emulation of Atmospheric Radiative Transfer

by Jiwen Fan 2 August 202213 February 2023

Using machine learning to represent sub-grid processes in weather and climate models holds promise, but also faces challenges. Incorporating physical knowledge can help.

Uranus and Neptune as seen by Voyager 2
Posted inResearch Spotlights

A Unified Atmospheric Model for Uranus and Neptune

by Morgan Rehnberg 1 August 20221 August 2022

In a new model, three substantial atmospheric layers appear consistent between the ice giants.

View of the University of Michigan Biological Station
Posted inResearch Spotlights

Using Sap Flow to Infer Plant Hydraulic Properties

by Morgan Rehnberg 29 July 202229 July 2022

The internal hydraulic properties of plants are difficult to measure but may be inferred from observable sap flow.

Flooding during June 2011 on the Missouri River floodplain near Arrow Rock, Mo.
Posted inResearch Spotlights

Missouri River Floodplain Expansion, Services, and Resiliency

Aaron Sidder, freelance science writer by Aaron Sidder 28 July 202221 September 2022

Benefits might accrue for both wildlife and climate resiliency if more floodplains along the lower Missouri River were allowed to flood.

Two Paluch diagrams, one showing a large-eddy simulation and one showing the new machine learning model.
Posted inEditors' Highlights

Modeling Entrainment with Machine Learning

by Jiwen Fan 27 July 20226 January 2023

Researchers present a new approach to modeling the stochastic mixing process of convection using a machine learning technique.

Diagrams showing the model fields used in the study.
Posted inEditors' Highlights

Landfalling Hurricanes Intensify Due to Coastal Downwelling

by Suzana Camargo 26 July 202221 September 2022

Hurricane winds can lead to coast downwelling, which brings warmer surface water near the coast and can contribute to the intensification of the landfalling hurricane.

Vancouver Island rising above the Strait of Juan de Fuca.
Posted inResearch Spotlights

Tracing Water Particles Back in Time

Aaron Sidder, freelance science writer by Aaron Sidder 22 July 202222 July 2022

Every summer, a low-oxygen pool settles off Canada’s western coast. A new study uses robust modeling to track the origins of the dense water.

Posts pagination

Newer posts 1 … 55 56 57 58 59 … 121 Older posts
Over a dark blue-green square appear the words Special Report: The State of the Science 1 Year On.

Features from AGU Publications

Research Spotlights

In Alaska, Wildfires Help Prevent Future Burns. Will That Feedback Loop Hold?

24 September 202625 September 2026
Editors' Highlights

Reducing Uncertainty in Groundwater Models Using Airborne Geophysics

28 September 202625 September 2026
Editors' Vox

Where Fire Ends, Chemistry Begins

30 September 202630 September 2026
Eos logo at left; AGU logo at right

About Eos
ENGAGE
Awards
Contact

Advertise
Submit
Career Center
Sitemap

© 2026 American Geophysical Union. All rights reserved Powered by Newspack