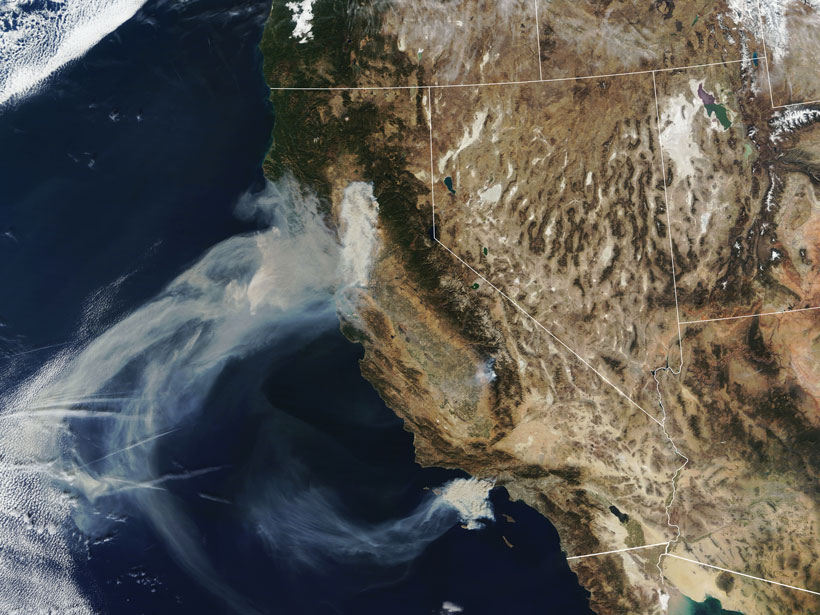
Fire is part of the natural ecology of most vegetated settings, but wildland fire is also a major—and increasing—hazard in many populated regions of the world, to which recent severe fires in Australia, California, Indonesia, South America, and elsewhere attest. Aggressive fire suppression policies during much of the 20th century have allowed fuel loads to grow artificially heavy, while settlements and agricultural enterprises progressively encroach on formerly pristine habitats. More broadly, shifting patterns of precipitation, lightning occurrence, and temperature in a changing climate are creating conditions that favor increasingly frequent and intense biomass burning, in ecosystems from boreal peatlands to tropical rain forests.
Operating from the ground, from observation towers, and from aircraft, fire response teams struggle to identify nascent ignitions over vast wilderness areas, to map active fire fronts and locate hot spots, and to track the dispersion of smoke plumes that can affect air quality hundreds of kilometers downwind of sources.
Remote sensing instruments are relatively blunt objects for characterizing wildfires and their impacts, compared with traditional in situ monitoring. However, they offer the advantage of providing frequent, broad coverage at minimal incremental cost and at no risk to observers. Over the past 20 years, the research community has developed tools and techniques to capture key aspects of fire behavior and impacts, with data from spaceborne instruments such as the Moderate Resolution Imaging Spectroradiometers (MODIS) aboard NASA’s Terra and Aqua satellites and the Multiangle Imaging Spectroradiometer (MISR) aboard Terra. This article reviews selected contributions that satellite instruments are making to advance our understanding and monitoring of, as well as our responses to, wildfires globally.
Fire Detection
Fire detection and fire front mapping are fundamental applications related to wildland fire with which satellite remote sensing can help. They rely on identifying bright anomalies in satellite-detected infrared radiance relative to background and are quantified with a measure called Fire Radiative Power (FRP), assessed at a wavelength of about 4 micrometers [e.g., Giglio et al., 2016].
The MODIS instruments, as well as the National Oceanic and Atmospheric Administration’s (NOAA) Visible Infrared Imaging Radiometer Suite (VIIRS) on the Suomi National Polar-orbiting Partnership and NOAA-20 satellites, all obtain twice-daily, near-global measurements used to determine FRP, with a fire pixel resolution of up to about 0.5–1 kilometer at nadir (directly below the satellite). The Advanced Baseline Imagers on NOAA’s Geostationary Operational Environmental Satellite (GOES)-16 and GOES-17 platforms (and on earlier NOAA geostationary satellites) perform fire detection much more frequently [e.g., Zhang et al., 2012] but at a lower resolution of no better than 2 kilometers at nadir.
With these single-view, multispectral imagers, spatial resolution diminishes and atmospheric opacity increases away from the nadir, so that many agricultural fires and other fires smaller than pixel resolution go undetected. However, the satellite data offer global coverage and can be automatically processed, enabling rapid response. Many imagers can also detect burn scars, which sometimes reveal the location and extent of smaller fires after the fact [Randerson et al., 2012].
Smoke Injection Height
Smoke injection height and source strength are the critical parameters representing aerosol sources in climate and air quality models. Satellites are providing observational constraints on both quantities.
Smoke tends to stay aloft longer, travel farther, and have a wider environmental impact if it rises above the near-surface planetary boundary layer (which is typically up to a few kilometers thick but depends on location and varies diurnally). Injection height and source strength are the critical parameters representing aerosol sources in climate and air quality models. Satellites are providing observational constraints on both these quantities.
Approximations of smoke injection height can be modeled based on the dynamical heat flux at the surface, the atmospheric stability structure, and the entrainment of ambient atmosphere into the rising plume. Combining FRP with representations of atmospheric structure from numerical weather models and simplified parameterizations of entrainment yields reasonable estimates of injection heights in many circumstances [e.g., Paugam et al., 2016]. Various factors introduce uncertainties, however, such as the coarse resolution at which FRP can be determined relative to the size of typical active burning areas, differences between the radiation emitted by flaming versus smoldering fires, and the sometimes substantial opacity of overlying smoke at relevant wavelengths [Kahn et al., 2008].
An alternative approach for determining injection heights involves using multiangle imaging to directly measure the parallax associated with smoke plume features identified as contrast patterns among adjacent pixels [e.g., Kahn et al., 2007]. The MISR instrument uses nine cameras pointed in the along-track direction that view at different angles ahead of, beneath, and behind the Terra satellite. As the satellite orbits Earth approximately pole to pole, these cameras sweep out a roughly 400-kilometer-wide swath in each of four spectral bands [Diner et al., 2005]. Spatial resolution is between 275 meters and 1.1 kilometers, depending on channel.
With such data, both smoke plume elevation and associated wind vectors can be derived geometrically, provided that contrast elements in the plume can be identified in multiple views (usually true near-source). The accuracy of heights retrieved with this technique is between 250 and 500 meters, except when wind vectors are aligned along-track, in which case small errors in wind direction can produce larger uncertainties. These retrievals cannot capture the very tops and bottoms of smoke plumes, but the distribution of retrieved heights gives an indication of a plume’s vertical extent.
Specialized software allows for plume height retrievals on a case-by-case basis with MISR data [Nelson et al., 2013]. Figure 1 provides an example of this capability for the Camp Fire, which burned roughly 620 square kilometers of Northern California in November 2018 in what became the state’s most destructive and deadly fire. As seen in Figures 1b and 1c, the plume reached its highest altitude, about 5 kilometers, near the source of the fire.
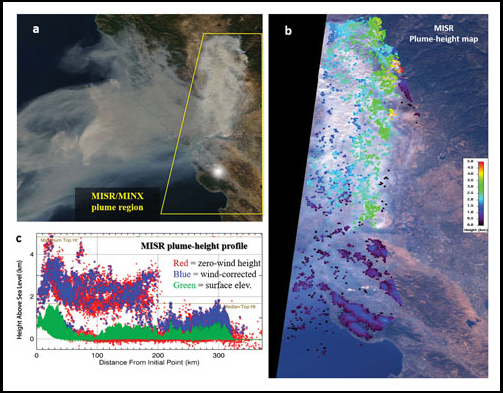
The main limitations of this technique are MISR’s relatively narrow swath, which provides global coverage only about once per week, and the roughly 10:30 a.m. equator-crossing time, which precludes observing diurnal fire variation and misses the typical afternoon peak in fire activity. Nevertheless, enough data have been collected during MISR’s 20 years in orbit to create a global climatology of representative plume heights, stratified by geographic region, biome, and season [Val Martin et al., 2018].
Recently, a technique to derive near-source plume layer heights using MODIS thermal infrared data was introduced [Lyapustin et al., 2019]. This approach entails more assumptions than the MISR geometric retrieval and, as with MISR, requires sufficient plume opacity to obtain a useful signal. Researchers have also explored using data from the Tropospheric Monitoring Instrument (TROPOMI) aboard the European Space Agency’s Sentinel-5 Precursor satellite for mapping plume layer heights (D. Griffin et al., The 2018 fire season in North America as seen by TROPOMI: Aerosol layer height validation and evaluation of model-derived plume heights, submitted to Atmospheric Measurement Techniques, 2019). MODIS and TROPOMI have much wider swaths than MISR, and the MODIS technique works at night and during daytime, so these methods offer the possibility of more frequent, global coverage.
Smoke Source Strength
Because FRP contains information about fire intensity, it has been used to estimate smoke source strength. One advanced approach divides the plume aerosol optical depth (AOD; a measure of atmospheric opacity caused by aerosols, also derived from MODIS) by the age of a plume, as derived from the plume’s horizontal extent in MODIS imagery and advection speed from a reanalysis model, to obtain a factor related to the smoke emission rate [Ichoku and Ellison, 2014]. The relationship between this factor and the FRP, evaluated over multiple cases, provides an ecosystem-specific emission coefficient that when multiplied by the FRP for an individual fire, yields an estimated source strength.
Other approaches rely on combining satellite-retrieved smoke plume opacities with a chemical transport model. The model is run either backward, starting with satellite-retrieved AODs over a wide area to derive source locations and emission intensities [e.g., Dubovik et al., 2008], or forward, starting with the known fire locations, initializing the model with various smoke source strengths, and comparing model-simulated AODs with data retrieved from space [Petrenko et al., 2017]. Better constraints on the assumptions in these models are required for many applications, such as climate prediction, and will also advance our ability to estimate smoke source strength with these methods for air quality forecasting [e.g., Li et al., 2019].
Smoke Plume Transport and Evolution
Because of gaps in satellite spatial and temporal coverage and ambiguities in determining aerosol type, chemical transport models, which represent particle dispersion, physical and chemical transformation, and deposition processes, play a central role in mapping the downwind evolution of smoke plumes. Yet satellites offer observations that are essential for constraining and validating model simulations of transports [e.g., Ichoku et al., 2012].
Scientists map aerosol plumes during transport—sometimes hundreds or even thousands of kilometers from sources—using imagery from broad-swath, single-view imagers such as MODIS and VIIRS. Instruments such as the Atmospheric Infrared Sounder aboard Aqua and the Measurement of Pollution in the Troposphere sensor aboard Terra also track transport and dispersion of gases like carbon monoxide from fires [e.g., Witte et al., 2011; Liu et al., 2005]. Downwind plume elevation is often captured by the space-based lidar aboard the Cloud-Aerosol Lidar and Infrared Pathfinder Satellite Observation (CALIPSO) satellite. CALIPSO data are complemetary to MISR plume height retrievals, as MISR provides much greater coverage but can obtain results only from near-source, whereas CALIPSO can sample diffuse but much more extensive smoke layers downwind [Kahn et al., 2008].
Multiangle, multispectral MISR data also provide qualitative constraints on aerosol microphysical properties, including particle size, spectral light absorption, and shape [Kahn and Gaitley, 2015]. Such information offers clues to the physical and chemical mechanisms operating as smoke plumes evolve. Retrievals of these particle properties depend on smoke plumes having sufficiently high AOD, which is usually not a problem near smoke sources.
A research version of the MISR aerosol algorithm, running on a case-by-case basis, is optimized for these retrievals [e.g., Limbacher and Kahn, 2014]. Observations from this algorithm are useful in identifying processes such as size-selective or size-independent particle deposition, particle oxidation and/or hydration, particle aggregation, and new particle formation. Such analysis has recently been applied to volcanic as well as smoke plumes [e.g., Flower and Kahn, 2020].
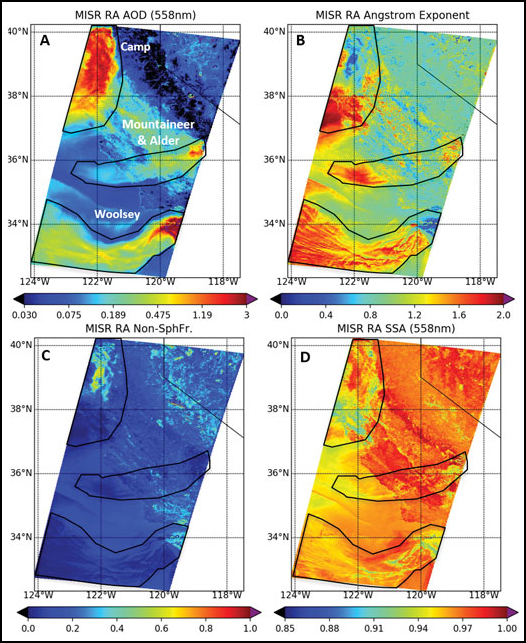
Figure 2 shows MISR research algorithm results for four major California fires burning on 9 November 2018. Note that for the Camp Fire, smoke generated by burning in the town of Paradise (in the north central portion of the outlined plume) contains distinctly larger, brighter, and more nonspherical particles than smoke generated from the surrounding vegetation.
Implications and Future Prospects
Among the first results from the emerging global picture of wildland fires provided by satellites is that up to about 20% of satellite-detected fires in North America inject smoke above the planetary boundary layer and that generally, boreal forest fires produce the largest fraction of elevated smoke plumes, whereas agricultural fires tend to inject smoke only within the boundary layer [e.g., Val Martin et al., 2010]. Under favorable meteorological conditions, including moist atmospheric layers concentrated in the midtroposphere [Peterson et al., 2017], pyrocumulonimbus have also been identified in the satellite data [e.g., Fromm et al., 2010]. These extreme fire-driven weather phenomena can inject smoke into the lower stratosphere, where it might remain for several months, traversing the globe and possibly having climate impacts comparable to those of injections from moderate volcanic eruptions [Peterson et al., 2018].
Using regional-scale, multiyear satellite data detailing smoke amount, particle type, and dispersion, patterns relating plume properties to vegetation types have been examined for Indonesia [Tosca et al., 2011], peatlands in the Maritime Continent of Southeast Asia [Lee et al., 2018], and multiple Amazon ecosystems [Gonzalez-Alonso et al., 2019]. Conditions producing different proportions of black and brown carbon particles, and their evolution downwind, are being assessed. Relationships between smoke and cloud properties are also beginning to provide constraints on aerosol–cloud interactions [e.g., Tosca et al., 2014].
These applications represent early steps toward realizing the many contributions that satellite products can make to understanding and responding to wildfire environmental impacts on both short and long timescales.
With recent advances in imagers on geostationary platforms, limitations on satellite diurnal coverage of fires are being reduced. Space-based infrared hot spot detection from broad-swath imagers and smoke injection heights from multiangle imagers have been used experimentally to locate fires and forecast air quality hazards in emergency response situations [e.g., Solomos et al., 2015]. And initial efforts are being made to constrain climate models with satellite-derived smoke source strength and injection height data.
These applications represent early steps toward realizing the many contributions that satellite products can make to understanding and responding to wildfire environmental impacts on both short and long timescales. As techniques for extracting information about wildfires and their smoke plumes are refined further, future spacecraft instruments, possibly in combination with smallsats and drones, can be designed to optimize data for these applications.
Acknowledgments
My work is supported in part by NASA’s Climate and Radiation Research and Analysis Program under Hal Maring, NASA’s Atmospheric Composition Mapping and Analysis Program under Richard Eckman, and the NASA Earth Observing System’s Terra project. I thank Verity Flower, Charles Ichoku, Kathrine Junghenn Noyes, Lauren Zamora, David Diner, Xiaohua Pan, and editor Timothy Oleson for comments on an early version of this article.
References
Diner, D. J., et al. (2005), The value of multiangle measurements for retrieving structurally and radiatively consistent properties of clouds, aerosols, and surfaces, Remote Sens. Environ., 97(4), 495–518, https://doi.org/10.1016/j.rse.2005.06.006.
Dubovik, O., et al. (2008), Retrieving global aerosol sources from satellites using inverse modeling, Atmos. Chem. Phys., 8, 209–250, https://doi.org/10.5194/acp-8-209-2008.
Flower, V. J. B., and R. A. Kahn (2020), Interpreting the volcanological processes of Kamchatka, based on multi-sensor satellite observations, Remote Sens. Environ., 237, 111585, https://doi.org/10.1016/j.rse.2019.111585.
Fromm, M., et al. (2010), The untold story of pyrocumulonimbus, Bull. Am. Meteorol. Soc., 91, 1,193–1,209, https://doi.org/10.1175/2010BAMS3004.1.
Giglio, L., W. Schroeder, and C. O. Justice (2016), The collection 6 MODIS active fire detection algorithm and fire products, Remote Sens. Environ., 178, 31–41, https://doi.org/10.1016/j.rse.2016.02.054.
Gonzalez-Alonso, L., M. Val Martin, and R. A. Kahn (2019), Biomass-burning smoke heights over the Amazon observed from space, Atmos. Chem. Phys., 19, 1,685–1,702, https://doi.org/10.5194/acp-19-1685-2019.
Ichoku, C., and L. Ellison (2014), Global top-down smoke-aerosol emissions estimation using satellite fire radiative power measurements, Atmos. Chem. Phys., 14, 6,643–6,667, https://doi.org/10.5194/acp-14-6643-2014.
Ichoku, C., R. Kahn, and M. Chin (2012), Satellite contributions to the quantitative characterization of biomass burning for climate modeling, Atmos. Res., 111, 1–28, https://doi.org/10.1016/j.atmosres.2012.03.007.
Kahn, R. A., and B. J. Gaitley (2015), An analysis of global aerosol type as retrieved by MISR, J. Geophys. Res. Atmos., 120(9), 4,248–4,281, https://doi.org/10.1002/2015JD023322.
Kahn, R. A., et al. (2007), Aerosol source plume physical characteristics from space-based multiangle imaging, J. Geophys. Res., 112, D11205, https://doi.org/10.1029/2006JD007647.
Kahn, R. A., et al. (2008), Wildfire smoke injection heights: Two perspectives from space, Geophys. Res. Lett., 35(4), L04809, https://doi.org/10.1029/2007GL032165.
Lee, H., et al. (2018), Characterization of wildfire-induced aerosol emissions from the Maritime Continent peatland and Central African dry savannah with MISR and CALIPSO aerosol products, J. Geophys. Res. Atmos., 123(6), 3,116–3,125, https://doi.org/10.1002/2017JD027415.
Li, F., et al. (2019), Historical (1700–2012) global multi-model estimates of the fire emissions from the Fire Modeling Intercomparison Project (FireMIP), Atmos. Chem. Phys., 19, 12,545–12,567, https://doi.org/10.5194/acp-19-12545-2019.
Limbacher, J. A., and R. A. Kahn (2014), MISR research-aerosol-algorithm refinements for dark water retrievals, Atmos. Meas. Tech., 7, 3,989–4,007, https://doi.org/10.5194/amt-7-3989-2014.
Liu, J., et al. (2005), Satellite mapping of CO emission from forest fires in northwest America using MOPITT measurements, Remote Sens. Environ., 95(4), 502–516, https://doi.org/10.1016/j.rse.2005.01.009.
Lyapustin, A., et al. (2019), MAIAC thermal technique for smoke injection height from MODIS, IEEE Geosci. Remote Sens. Lett., 1–5, https://doi.org/10.1109/LGRS.2019.2936332.
Nelson, D. L., et al. (2013), Stereoscopic height and wind retrievals for aerosol plumes with the MISR Interactive Explorer (MINX), Remote Sens., 5(9), 4,593–4,628, https://doi.org/10.3390/rs5094593.
Paugam, R., et al. (2016), A review of approaches to estimate wildfire plume injection height within large-scale atmospheric chemical transport models, Atmos. Chem. Phys., 16, 907–925, https://doi.org/10.5194/acp-16-907-2016.
Peterson, D. A., et al. (2017), A conceptual model for development of intense pyrocumulonimbus in western North America, Mon. Weather Rev., 145, 2,235–2,255, https://doi.org/10.1175/MWR-D-16-0232.1.
Peterson, D. A., et al. (2018), Wildfire-driven thunderstorms cause a volcano-like stratospheric injection of smoke, npj Clim. Atmos. Sci., 1, 30, https://doi.org/10.1038/s41612-018-0039-3.
Petrenko, M., et al. (2017), Refined use of satellite aerosol optical depth snapshots to constrain biomass burning emissions in the GOCART model, J. Geophys. Res. Atmos., 122(20), 10,983–11,004, https://doi.org/10.1002/2017JD026693.
Randerson, J. T., et al. (2012), Global burned area and biomass burning emissions from small fires, J. Geophys. Res. Biogeosci., 117(G4), G04012, https://doi.org/10.1029/2012JG002128.
Solomos, S., et al. (2015), Smoke dispersion modeling over complex terrain using high resolution meteorological data and satellite observations—The FireHub platform, Atmos. Environ., 119, 348–361, https://doi.org/10.1016/j.atmosenv.2015.08.066.
Tosca, M. G., et al. (2011), Dynamics of fire plumes and smoke clouds associated with peat and deforestation fires in Indonesia, J. Geophys. Res. Atmos., 116(D8), D08207, https://doi.org/10.1029/2010JD015148.
Tosca, M. G., et al. (2014), Observational evidence of fire-driven reduction of cloud fraction in tropical Africa, J. Geophys. Res. Atmos., 119(13), 8,418–8,432, https://doi.org/10.1002/2014JD021759.
Val Martin, M., et al. (2010), Smoke injection heights from fires in North America: Analysis of 5 years of satellite observations, Atmos. Chem. Phys., 10, 1,491–1,510, https://doi.org/10.5194/acp-10-1491-2010.
Val Martin, M., R. A. Kahn, and M. Tosca (2018), A global analysis of wildfire smoke injection heights derived from space-based multi-angle imaging, Remote Sens., 10(10), 1609, https://doi.org/10.3390/rs10101609.
Witte, J. C., et al. (2011), NASA A-Train and Terra observations of the 2010 Russian wildfires, Atmos. Chem. Phys., 11, 9,287–9,301, https://doi.org/10.5194/acp-11-9287-2011.
Zhang, X., et al. (2012), Near-real-time global biomass burning emissions product from geostationary satellite constellation, J. Geophys. Res. Atmos., 117(D14), D14201, https://doi.org/10.1029/2012JD017459.
Author Information
Ralph Kahn ([email protected]), Earth Science Division, NASA Goddard Space Flight Center, Greenbelt, Md.
Citation:
Kahn, R. (2020), A global perspective on wildfires, Eos, 101, https://doi.org/10.1029/2020EO138260. Published on 27 January 2020.
Text not subject to copyright.
Except where otherwise noted, images are subject to copyright. Any reuse without express permission from the copyright owner is prohibited.