Inaugural Workshop on Thermal Analysis of Natural Organic Matter; Woods Hole, Massachusetts, 15–16 September 2016
Climate Change
Posted inScience Updates
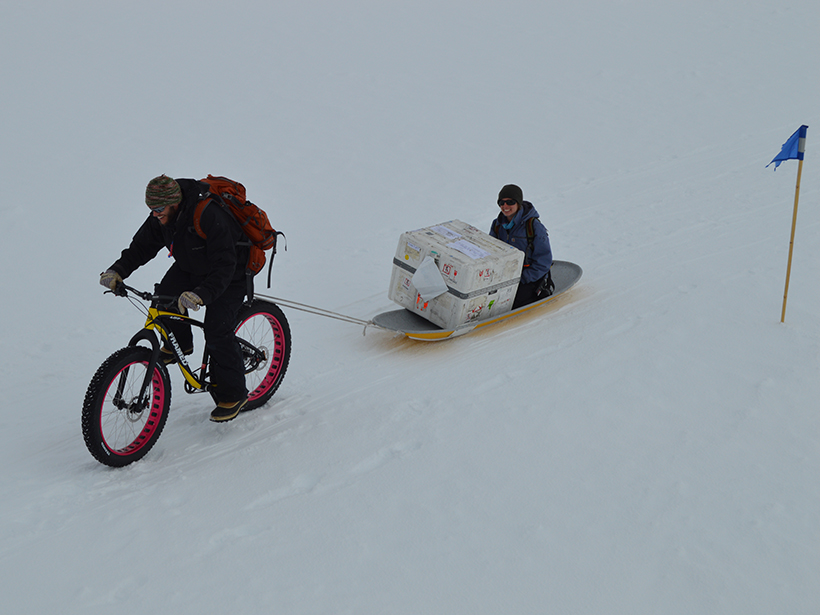
Envisioning and Sustaining Science at Summit Station, Greenland
Summit Station Science Summit; Arlington, Virginia, 28–29 March 2017

Posted inOpinions
Taking the Pulse of the Planet
How fast is Earth warming? Ocean heat content and sea level rise measurements may provide a more reliable answer than atmospheric measurements.
Posted inFeatures
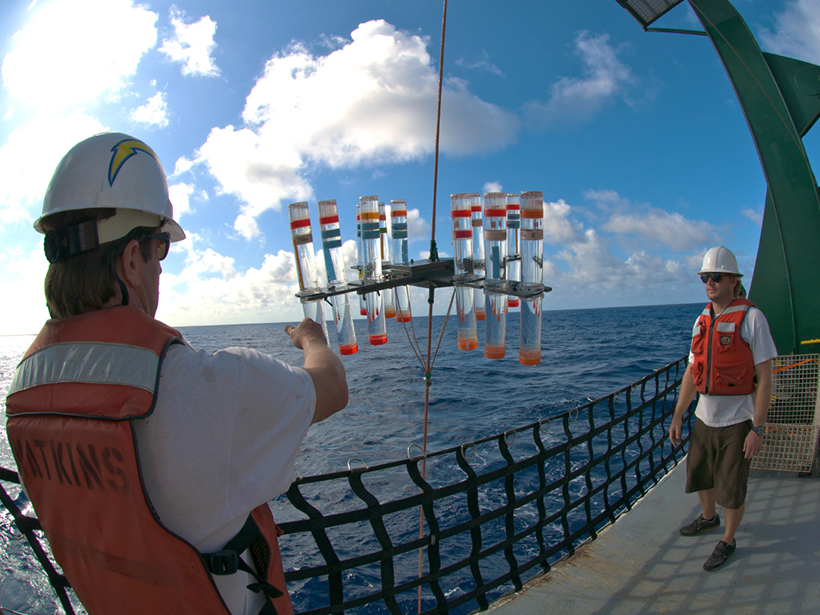
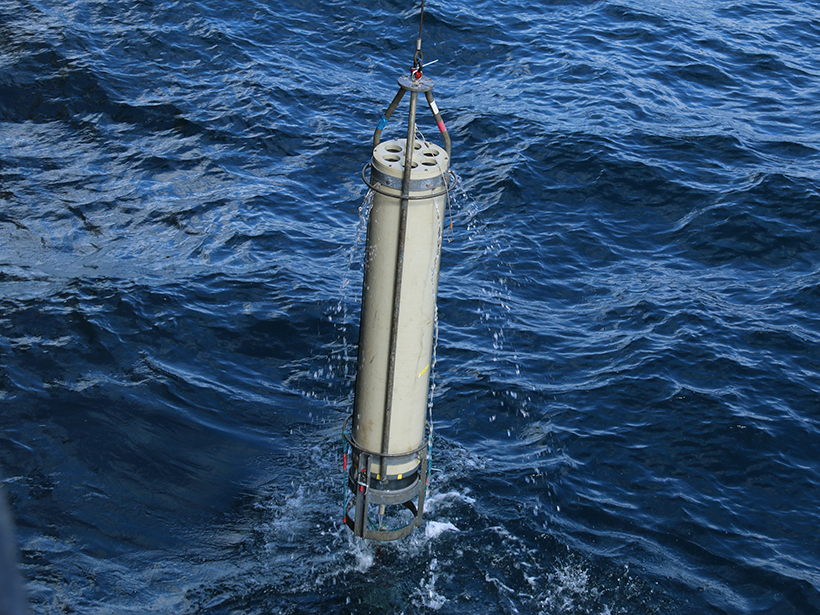
Monitoring Ocean Change in the 21st Century
Time series data sets, which contain measurements repeated over a span of decades, yield important insights into our oceans’ vital signs.
Posted inResearch Spotlights
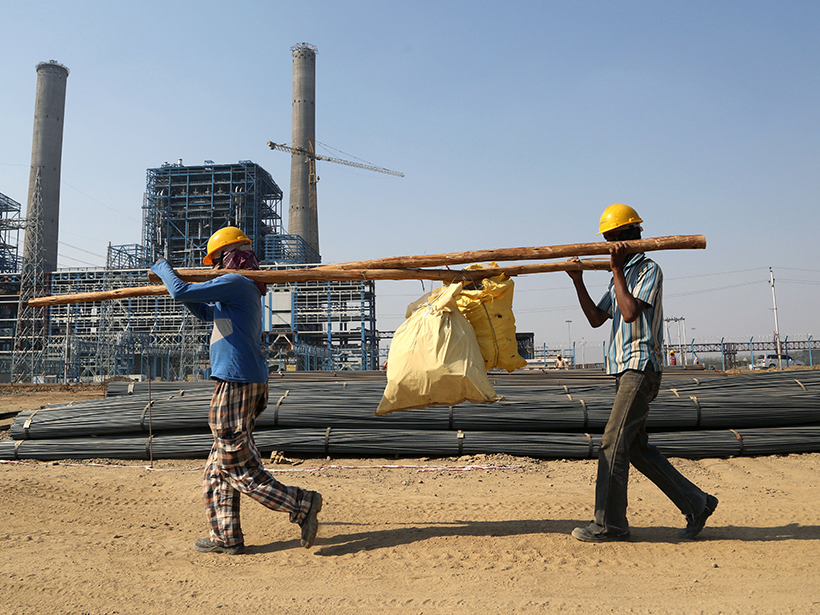
India’s Plans for Coal Clash with Paris Agreement
India’s proposed coal plants threaten to lock out its low-emission energy goals under the international climate accord.

Posted inScience Updates
Coordinating and Communicating Carbon Cycle Research
2017 Joint NACP and AmeriFlux Principal Investigators Meeting; Bethesda, Maryland, 27–30 March 2017

Posted inOpinions
A Diary of a Storm
When Hurricane Harvey struck Texas more than a week ago, an Eos staff editor based in Houston hunkered down. Here’s her day-by-day account of the storm and its aftermath.
Posted inResearch Spotlights
New Evidence Challenges Prevailing Views on Marine Carbon Flux
Small, slow-sinking organic particles may play a bigger role than previously thought in the transport of carbon below the surface ocean.

Posted inNews
Engineering New Foundations for a Thawing Arctic
Researchers experiment with new building supports to prepare the Arctic for rapid shifts in permafrost and ground stability.

Posted inResearch Spotlights
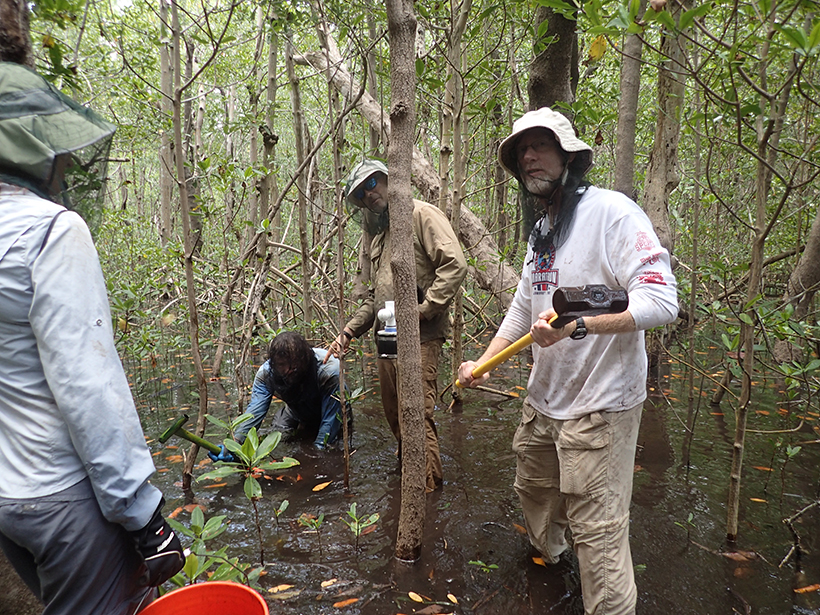
Coastal Wetlands Effectively Sequester “Blue Carbon”
Mangrove forests, salt marshes, seagrass beds, and the like are carbon storage treasure troves.