Earthquakes result in thousands of lost lives every year. Risks from seismic shaking can be reduced if scientists better understand major earthquakes and forecast them far enough in advance to help residents evacuate or find shelter. Such goals remain elusive, but studying controls on seismic cycles—the repeated sticking and slipping of faults—will reveal key insights.
We recently set out to observe and study stress buildup, earthquake rupture, and fault properties on a distant offshore fault thought to be most of the way through its cycle. The 170-kilometer-long Gofar transform fault includes three fault segments and is located roughly 1,500 kilometers west of the Galápagos Islands on the equatorial East Pacific Rise (EPR; Figure 1). This area is particularly conducive to such observations because of its short seismic cycles. As planned, we arrived on-site and placed our instruments on the seafloor in time to record the end of the seismic cycle, including a magnitude 6 main shock earthquake. Here we discuss highlights and lessons learned from our ambitious endeavor to understand this undersea fault.

Why Study Undersea Faults?
For centuries, earthquake scientists have worked to understand the evolution of stress, strength, and material properties in fault zones with enough precision to forecast the magnitude and timing of future earthquakes. The basic hypothesis of seismic cycles is that stress builds up for an extended period over a large portion of a fault and then is released suddenly in a large earthquake. Yet verifying this hypothesis with data—and understanding the many nuances of seismic cycles—remains difficult because typical repeat times of large earthquakes are 50–1,000 years.
Oceanic transform faults on the EPR are ideal targets for investigating variations in seismicity, fault strength, and fluids within the context of well-known earthquake cycles. These faults, across which tectonic blocks shift horizontally past each other, occur at boundaries between tectonic plates—in this case between the Nazca and Pacific plates—and have slip rates up to 4 times faster than that of the San Andreas Fault. They also have much shorter seismic cycles, with earthquakes of approximately magnitude 6 repeating every 5–6 years.
A previous seismic investigation of the Gofar transform fault, conducted in 2008, successfully captured the end of an earthquake cycle, including foreshocks, the magnitude 6 main shock, and aftershocks [McGuire et al., 2012]. That experiment prompted new ideas and questions about fault mechanics and earthquake physics. Possibly the most surprising observation was that long-lived rupture barriers, which separate patches repeatedly struck by magnitude 6 earthquakes, are where small earthquakes (magnitude 5 or lower, with most lower than magnitude 2) occur most frequently on the Gofar fault. This observation challenged the expectation that rupture barriers, characterized by discontinuities in fault rock composition, damage intensity (i.e., how fractured and permeable the rock is), or fluid content, serve to stop earthquakes of all sizes in their tracks.
From 2019 to 2022, we conducted a new, multidisciplinary field experiment at the Gofar transform fault to further illuminate the fault’s cyclical behavior and address questions raised by the earlier work. Using the 2008 data set, we knew where and when (within a time window of ~1 year) to place our instruments to record another magnitude 6 earthquake.
Successfully forecasting and recording a large earthquake were a great accomplishment for both experiments. Because we had to pivot and adapt our research plans on the fly as a result of COVID-19 pandemic limitations, our recent project boasts the additional major (albeit unexpected) accomplishment of revealing lessons about successfully coordinating multidisciplinary seagoing expeditions that involve remote participation and opportunities to improve the accessibility and inclusivity of such projects.
Many Ways to Watch an Earthquake
We originally designed what was to be a 2-year experiment involving three cruises to capture the end of the earthquake cycle on the western segment of Gofar and to record varying fault properties in a rupture barrier.
Our team of seismologists, geologists, geochemists, and electromagnetic geophysicists included 24 faculty, postdocs, and students from seven institutions in Canada and the United States. We originally designed what was to be a 2-year experiment involving three cruises to capture the end of the earthquake cycle on the western segment of Gofar and to record the temporally and spatially varying fault properties in a rupture barrier. However, by the time the ship schedule for our first cruise was finalized, the anticipated earthquakes on the western segment had already occurred, so we reorganized the seismic and seafloor sampling efforts to span multiple fault segments. This revamped plan provided an opportunity to address questions about the western segment while we also observed a different patch to the east that was expected to host a magnitude 6 event soon.
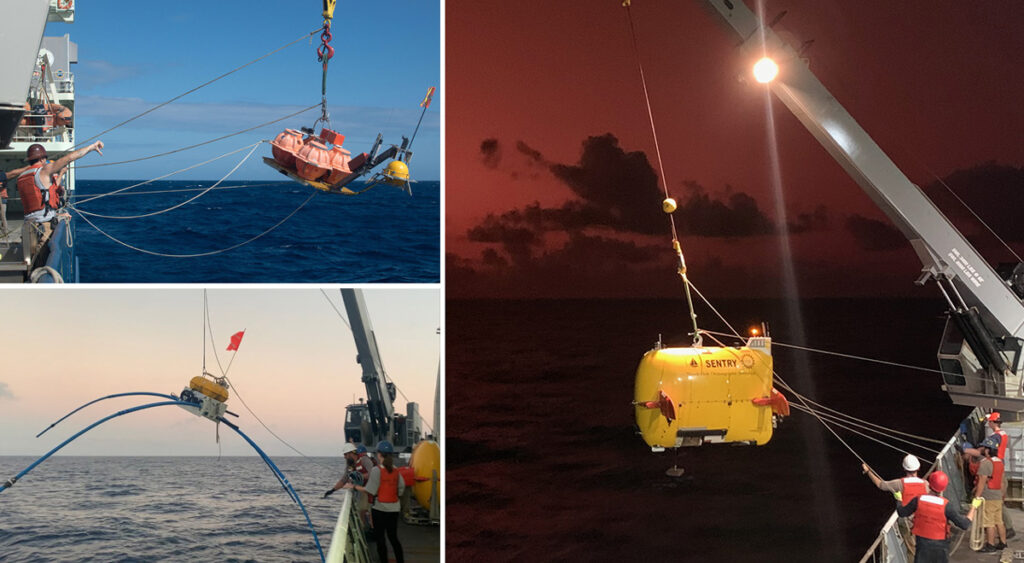
After departing San Diego in November 2019 on the first cruise of the project, we sailed 4,300 kilometers aboard R/V Atlantis to reach Gofar. There, we deployed ocean bottom seismographs (OBSs) by free fall (dropping them overboard to sink freely to the seafloor) to record microseismicity and target the sites of the next expected earthquakes on the eastern segment of the fault. We deployed additional OBSs to study a rupture barrier on the western segment using a challenging new approach that allowed us to position the instruments to within roughly 20 meters of planned locations by way of a wire line equipped with an ultrashort-baseline acoustic positioning beacon. These precise wire line deployments were time-consuming (taking 3.5 hours each rather than 30 minutes for a free fall) and challenging because of ocean currents and ship motion. However, they enabled us to position three 10-instrument miniarrays within 1.5 kilometers and in the rupture barrier to track the evolution of fault zone rigidity in detail through much of the seismic cycle.
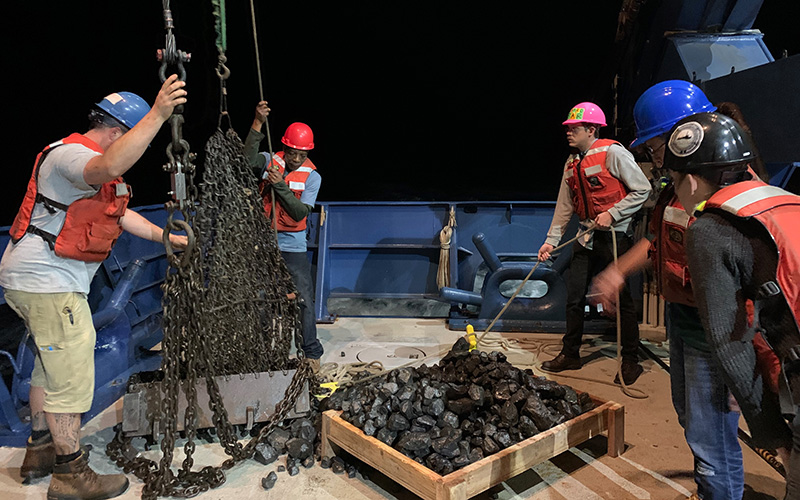
At night during the 25-day cruise, while the team members responsible for the OBSs were sleeping, the dredging team pulled up basketfuls of pillow basalts and basaltic breccias from seafloor transects across the Gofar fault, providing the first rock samples from the fault and hinting at its permeability structure. These rocks should illuminate whether rupture barriers are characterized by an intense damage zone that allows fluids to penetrate throughout the fault zone, inhibiting large earthquakes [Roland et al., 2012; Liu et al., 2020], or perhaps by mélange-like mixtures of strong mafic protolith and weak hydrothermally altered fault zone materials. With these fault zone samples recovered, we are now assessing the intertwined effects of damage and hydrothermal alteration and their influences on fault slip behavior.
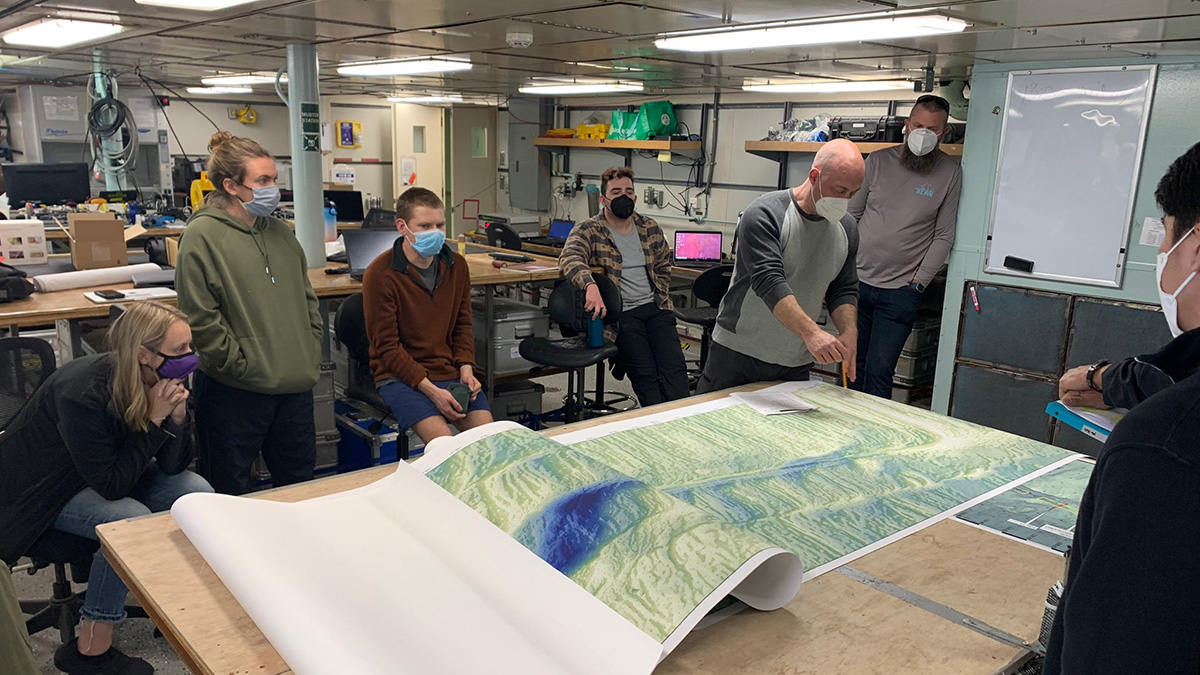
All told, during the three cruises of the project, our team twice deployed 51 OBSs and dredged rock samples from 16 sites, helping to provide a more comprehensive picture of the fault zone’s seismic behavior and composition than we’ve ever had. We also deployed 40 ocean bottom electromagnetic instruments and conducted 14 dives with the autonomous underwater vehicle (AUV) Sentry. Measurements of the seafloor’s electrical conductivity should provide insights into hydrothermal circulation patterns in the transform fault and whether there are deeper mechanisms, such as partial melts, driving that circulation. And with Sentry, we mapped the fault zone at high resolution (1-meter scale; Figure 2) and investigated key water column properties near the seafloor, providing additional information on the fault’s structure and hydrothermal activity.

As we flew home from Manzanillo, Mexico, in mid-December 2019 after the first (and what turned out to be the simplest) cruise was complete, we were especially excited that the wire line deployments had worked (a big uncertainty beforehand), and we were looking forward to recovering those data on the next leg of the project. Of course, we didn’t realize at the time that for most of us, it would be the last international trip we took for a while.
Critical Timing and Pandemic Challenges
The expected earthquake on the eastern segment of the Gofar occurred on 22 March 2020. What we did not predict was how complicated recovering the data would be after the onset of the pandemic.
Four months after our initial OBS deployment, the expected earthquake on the eastern segment of the Gofar—a magnitude 6.1 event—occurred on 22 March 2020. What we did not predict was how complicated recovering the data would be after the onset of the pandemic.
Batteries powering OBS clocks, which are vital for accurately tracking the timing of seismic data collected, last 12–14 months, and we needed to recover the OBSs before those clocks died. But pandemic-induced restrictions like social distancing required many research departments to operate fully remotely, and it wasn’t clear when or even if we would make it back to sea. Engineers at the Ocean Bottom Seismic Instrument Center (OBSIC) at Woods Hole Oceanographic Institution in Massachusetts were some of the only specialists working in their labs that spring, preparing instruments for upcoming but uncertain missions.
Gofar is a 10-day steam from the nearest U.S. port, making the trip a high-risk endeavor during the pandemic, considering the lack of medical facilities on oceanographic research vessels. If someone got sick on board, it would be potentially weeks before we could get them care back on shore. We spent months working closely with ship operators, the National Science Foundation (NSF), and OBSIC to plan (and replan) the cruise safely.
Finally, after spending 2 weeks in quarantine, a greatly reduced crew (the chief scientist was the only scientist on board) set sail in January 2021 (Figure 1), this time on R/V Thomas G. Thompson and wearing masks for the first 2 weeks of the 36-day voyage. That group recovered the OBSs and deployed instruments with fresh batteries to continue our experiment’s data collection—and thankfully no one fell ill.
During our final cruise in early 2022, we recovered the OBSs again, mapped the fault with Sentry, and conducted electromagnetic surveys. This busy cruise, initially planned to last 1 month, doubled in duration because of added scientific activities bumped from the second cruise and longer-than-anticipated transit times to and from port. It also set sail with a relatively small science party aboard, which presented a new set of challenges and opportunities.
New Opportunities at Sea and on Shore
Throughout the pandemic, accelerated satellite Internet was commonly added to shipboard infrastructure to facilitate the support of small seagoing science teams by remote participants on shore. However, during our second cruise, it became clear that the skeleton crew at sea had plenty of work to keep them occupied without adding complications of satellite-based data sharing, lengthy email briefings, and coordination between multiple time zones.
To succeed with the complex science activities scheduled for our third cruise, we had to ensure dedicated support for shore-to-sea communications. This meant having at least one at-sea scientist committed to this task. On land, an at-the-ready group of scientists met daily to review incoming data, and a contingent of this group was on call at all hours to communicate, plan, and troubleshoot.
The new approaches we adopted allowed us to accomplish all the goals of the cruise and, at the same time, opened opportunities for young scientists to gain experience and minimized disruptions to scientists’ lives on land.
We also assembled a team of 12 seagoing scientists and technicians—diverse in terms of participants’ career stages, genders, and backgrounds—to execute cruise activities. At-sea team members included postdocs and students who were able to join the extended cruise in place of scientists scheduled for the original 1-month cruise, many of whom had family and teaching obligations that kept them ashore. The at-sea participants also included three paid research assistants (hired out of an applicant pool of more than 90). This model of paying watch standers may foster inclusion in the geosciences by improving the accessibility of research cruises to those interested in the field but who cannot otherwise afford to participate.
The new approaches we adopted allowed us to accomplish all the goals of the cruise and, at the same time, opened opportunities for young scientists to gain experience and minimized disruptions to scientists’ lives on land. With at-sea scientists ready to assist with communications and an AUV team that was willing to be agile in the face of short-notice changes and requests, our shore-based scientists planned each 12-hour Sentry dive in real time from our offices and living rooms. Emails between ship and shore were sent around the clock during the 30 days on-site at Gofar on the third cruise, some sharing complex dive plan details, others with simple updates about the status or events of a dive.
The level of onshore contributions to decisions at sea in this expedition was unprecedented in our experience. Given the success of the cruise, we hope the approaches we used will become more common in the future, increasing access to remote science and allowing those who cannot practically go to sea to be involved in seagoing science.
Almost Half of a Seismic Cycle
In total, we recorded an unprecedented oceanic transform fault earthquake catalog of more than half a million earthquakes of magnitude between 0 and 6.1. This catalog represents about 40% of the seismic cycle on multiple segments of the Gofar transform fault—equivalent to more than 50 years of recording on many segments of the San Andreas Fault.
With our multidisciplinary data freshly collected, we are now investigating key questions about the 4D variations in stress, strength, and other properties that govern the end of seismic cycles. What are the geological and material properties at locations that repeatedly stop large ruptures but allow intense foreshock sequences to nucleate? Are the intense foreshock sequences in rupture barriers associated with slow slip, transient fluid flow, or regions of pervasive hydrothermal alteration?
More Gofar transform fault earthquakes are just around the corner. With this integrated data set, we will be better able to explain how, where, and when these earthquakes will occur.
Acknowledgments
We acknowledge the other principal investigators of this project, including Mark Behn, Wenyuan Fan, Chris German, Yajing Liu, and Jeff McGuire, as well as additional members of the 4CASTGofar team, including Janine Andrys, Chris Armerding, Eric Attias, Melinda Bahruth, Hannah Brewer, Christine Chesley, Kate Enright, Clément Estève, Bailey Fluegel, Andrew Gase, Jianhua Gong, Jae Deok Kim, Paige Koenig, Kuan-Yu Lin, Tianze Liu, Thomas Morrow, Pamela Moyer, Jake Perez, Cécile Prigent, Darin Schwartz, and Emilia Topp-Johnson, whose work is integral to this project. Our experiment wouldn’t have been possible without the dedication of the OBSIC, Sentry, and electromagnetic teams as well as of the crews of the Atlantis and Thompson. This work is supported by NSF grants OCE-1832830, OCE-1832868, OCE-1833279, OCE-2128784, and OCE-1922528.
References
Liu, Y., J. J. McGuire, and M. D. Behn (2020), Aseismic transient slip on the Gofar transform fault, East Pacific Rise, Proc. Natl. Acad. Sci. U. S. A., 117(19), 10,188–10,194, https://doi.org/10.1073/pnas.1913625117.
McGuire, J. J., et al. (2012), Variations in earthquake rupture properties along the Gofar transform fault, East Pacific Rise, Nat. Geosci., 5, 336–341, https://doi.org/10.1038/ngeo1454.
Roland, E., et al. (2012), Seismic velocity constraints on the material properties that control earthquake behavior at the Quebrada-Discovery-Gofar transform faults, East Pacific Rise, J. Geophys. Res. Solid Earth, 117(B11), B11102, https://doi.org/10.1029/2012JB009422.
Author Information
Margaret Boettcher ([email protected]), University of New Hampshire, Durham; Emily Roland, Western Washington University, Bellingham; Jessica Warren, University of Delaware, Newark; and Robert Evans and John Collins, Woods Hole Oceanographic Institution, Woods Hole, Mass.