
The Landsat program has produced an unmatched record of observational coverage of Earth’s surface extending back to 1972, offering stunning satellite views of landscapes all over the world. This collaboration between NASA and the U.S. Geological Survey (USGS) has also yielded more than 5 decades of scientific discoveries as Earth’s climate has changed.
From the program’s earliest data collection, Landsat’s coverage has included the polar regions, which have exhibited some of the most rapid and dramatic examples of global change—notably with the effects of rising temperatures on polar ice. However, the planet’s highest latitudes have not been imaged during the long periods of polar twilight and darkness, except by special requests made by scientists to image specific regions.
Observations collected during special requests have proven Landsat’s capabilities to capture surface details and clearly track winter ice formation even in low lighting conditions.
Observations collected during such special requests have proven Landsat’s capabilities to capture surface details and clearly track winter ice formation and polar ocean surface temperatures even in low lighting conditions. And a new acquisition plan for the Landsat 8 and 9 satellites, dubbed Landsat Extended Acquisition of the Poles (LEAP) and first implemented in 2022, has greatly improved coverage during low- and even no-light seasons.
Instruments aboard the Landsat 8 and 9 satellites collect visual, near-infrared, and thermal infrared (heat) images. Landsat 8’s Operational Land Imager (OLI) sensor and Landsat 9’s OLI-2 sensor exhibit high sensitivity. In addition, the spatial resolution of Landsat 8’s Thermal Infrared Sensor (TIRS) and Landsat 9’s TIRS-2 is far better than the resolution of other commonly used satellite thermal sensors (100 meters for Landsat versus 375–1,000 meters for other sensors).
With the LEAP plan in place, Landsat’s instrumental capabilities provide opportunities to detail changes in the polar ice sheet margins, track extremes in polar surface temperature, and investigate interactions between ice masses and ocean water during polar winter, thus extending the observational record to the entire annual cycle.
Missing Much of the Polar Picture
The global imaging acquisition plan for Landsat has led to a wealth of insights. However, Landsat typically has not collected images when the Sun is less than 5° above the horizon.
Landsat acquired its first images of the cryosphere over southeastern Alaska and eastern Greenland in summer 1972. This was followed by expanded early mapping of the Antarctic coastline. Before Landsat imaged these coastal areas, the only people who had seen some of them—during any time of year—were explorers and aerial photographers participating in post–World War II missions to map the continent’s margins, such as Operations Highjump and Windmill, the Ronne expedition, and the United Kingdom’s Falkland Islands and Dependencies Aerial Survey Expedition [Clancy et al., 2014]. Today USGS is reprocessing and regeolocating early satellite images of the polar regions as part of its effort to upgrade its archive and render the older images more useful for comparison with modern imagery.
The global imaging acquisition plan for Landsat covering Earth’s land, freshwater, coastal, and land ice areas has led to a wealth of insights and published research [e.g., Wulder et al., 2022; Roy et al., 2014]. However, Landsat typically has not collected images when the Sun is less than 5° above the horizon (the standard solar elevation acquisition limit). This limit means, for example, that imagery has not been acquired for areas in the northern third of Greenland from late September to mid-March, except by requests during a handful of brief periods. Similarly, little imagery has been collected over or around Antarctica from March to September.
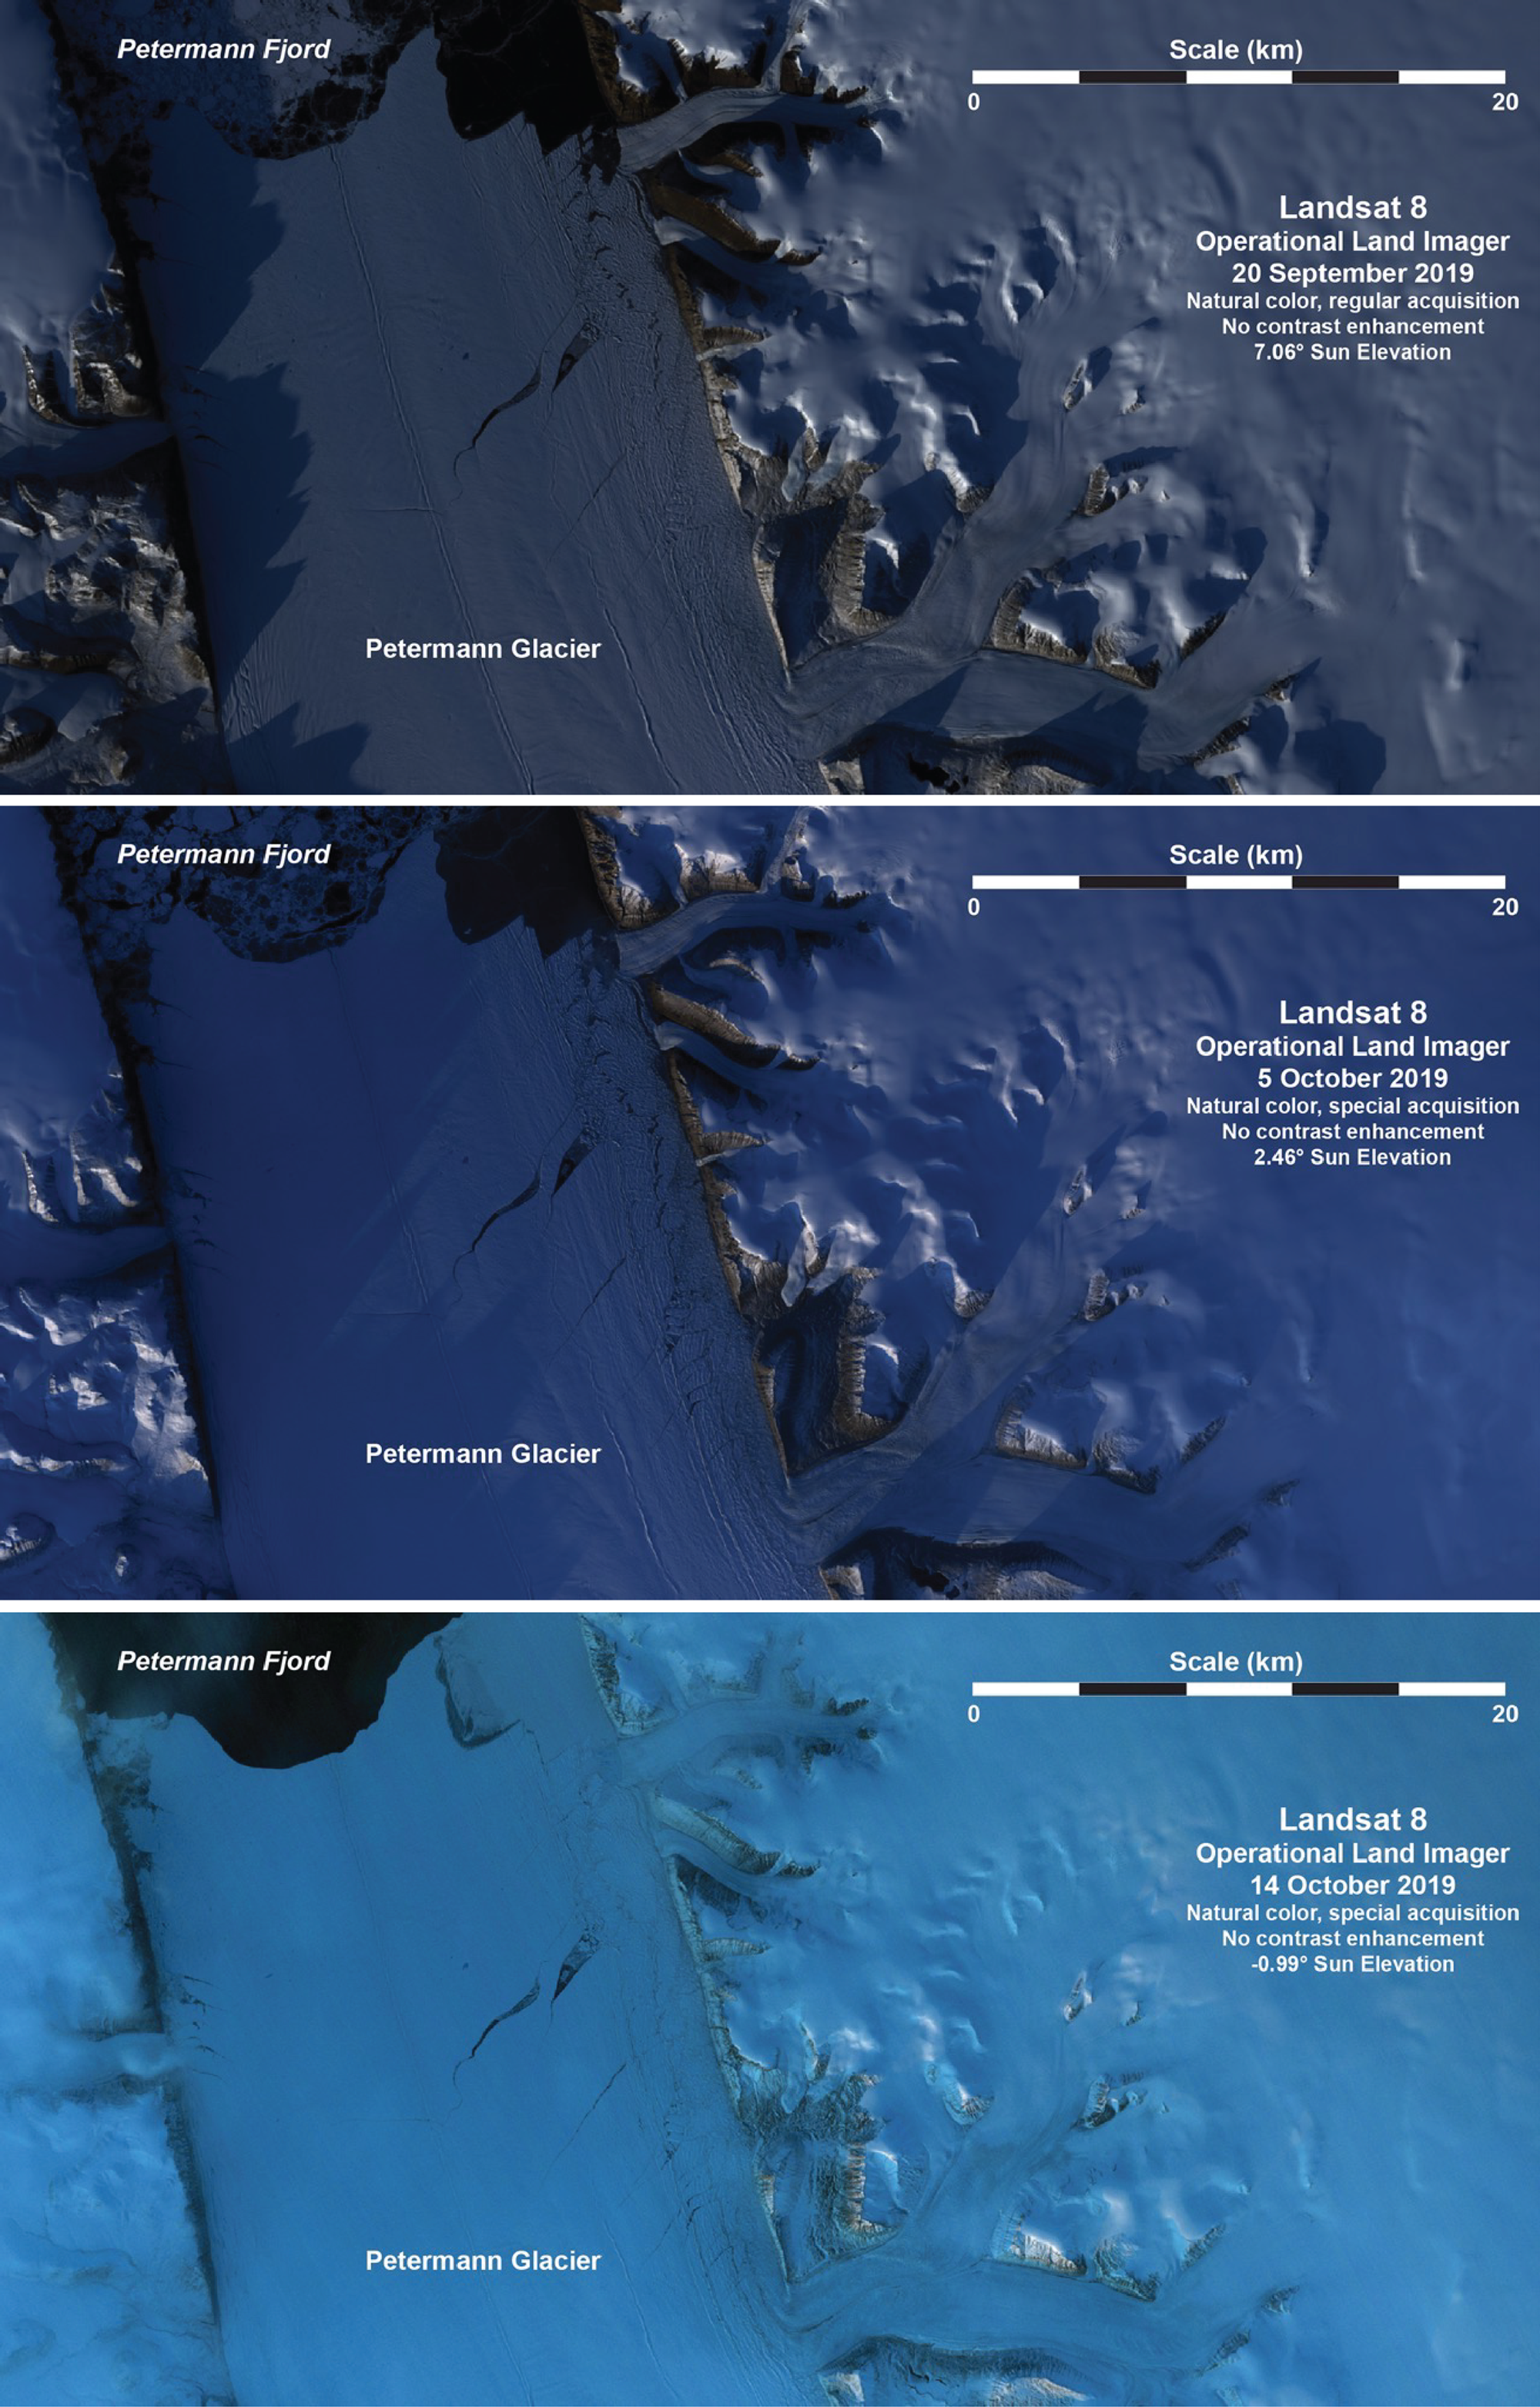
The few special-request images that have been collected, however, demonstrate that current Landsat instruments can produce high-quality data even when the Sun is near or below the horizon. For example, images of northern Greenland’s Petermann Glacier (81°N), acquired under a special collection in September and October 2019, showed that details of the glacier’s ice tongue and surrounding mountains are easily visible with the Landsat 8 OLI sensor, even at -1° solar elevation (Figure 1). Furthermore, where there is high optical contrast present on the imaged surface, features such as snow cover and processes such as ice front calvings, sea ice formation and dynamics, and the development of crevasses and rifts are apparent with only twilight illumination.
Seeing in the Dark
Landsat 8 and 9 optical sensors return no data beyond about -5° solar elevation, but in twilight conditions or even total darkness, the satellites’ thermal sensors provide unexpected details of surface structures, ocean temperatures, and sea ice thickness and concentration.
Surface morphology in many polar regions, especially over land and ice, is revealed by thermal imagery in excellent detail under clear-sky conditions because of an intense, thin thermal inversion layer near the surface (Figure 2). This inversion forms as the snow surface cools by radiating heat to space, chilling the air just above it by several degrees. Flat surfaces or valley floors, where the cooled air pools, show very low temperatures relative to local conditions, but topographic features even a few meters higher are revealed because they penetrate the thin inversion layer and come in contact with warmer air temperatures.

Larger domes and mountain slopes show more complex relationships with elevation. The near-surface inversion layer present at the base is topped by a warmer band on the lowest slopes, and then temperatures gradually decrease going up the flanks of 100- to 1,000-meter-high domes or mountains because of the atmospheric lapse rate.
Thermal images taken under winter conditions reveal subtle surface features and temperatures of sea ice.
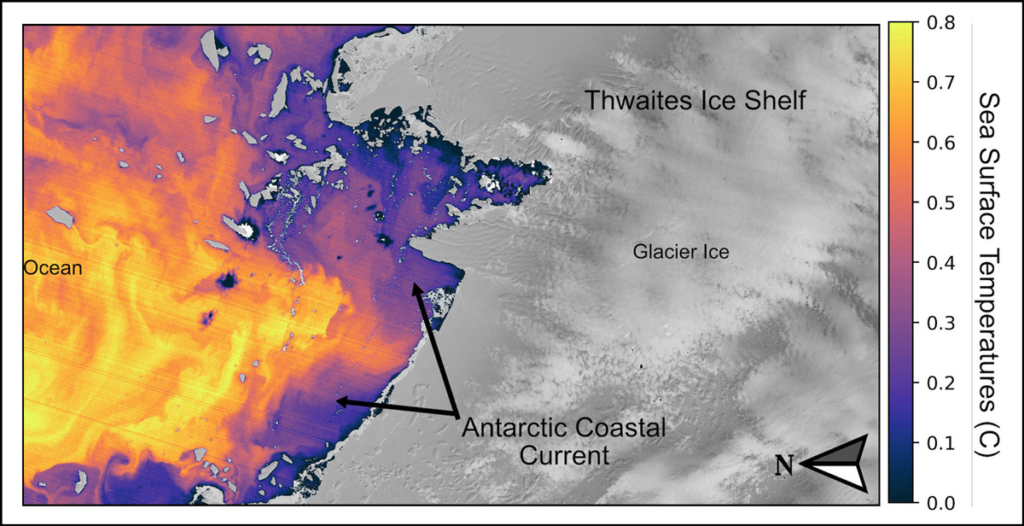
Thermal images taken under winter conditions also reveal subtle surface features and temperatures of sea ice, as well as details of sea surface temperatures in the polar oceans. Sea ice is thin, and therefore relatively warm (bright) as it forms on the ocean surface near ice shelf edges or glacial fronts. Offshore winds from the continent push new sea ice oceanward, where it gradually thickens. Bright leads of relatively warm ocean water are seen between the bergs and floes (Figure 2). And in regions where ocean circulation and temperatures vary substantially near the edge of an ice sheet, thermal-band mapping can reveal details of ice, ocean, and wind interactions near the surface (Figure 3). LEAP will extend the potential for tracking these interactions to the entire seasonal cycle.
Sensing Extreme Temperatures
Other special Landsat acquisitions have documented polar winter minimum temperatures—some of them record-setting—on the East Antarctic Plateau. Scambos et al. [2018], for example, reported surface temperatures of -94°C in several small depressions in the upper East Antarctic Plateau from Landsat data. Observations of similar conditions in Greenland have revealed winter snow surface temperatures of about -74°C near the center of the ice sheet.
LEAP acquisitions include collection of imagery over the central ice divides (where the ice flows in opposite directions on either side) on both the Antarctic and Greenland ice sheets. These collections will facilitate monitoring of the lowest temperatures and the conditions that lead to record cold events. With the improved surface temperature record from Landsat 8 TIRS and Landsat 9 TIRS-2 sensor data [Crawford et al., 2023], we expect that much more robust mapping of temperature variations across the ice sheets and sea ice will be possible.
Further, thermal data acquired over interior polar weather stations, where on-the-ground measurements are made (e.g., Summit Station, Greenland), will improve the low-temperature calibration of the Landsat sensors. These additional image data will also support cloud masking efforts—which involve digitally removing clouds and their shadows from images to produce unobstructed views of the surface—over the ice sheets, helping address a continuing issue in analyzing polar nighttime images.
Mapping Year-Round
LEAP acquisitions provide coverage of Earth’s high latitudes through winter, enabling high-resolution year-round study of ice-ocean interfaces and mapping of polar surface ocean and sea ice thermal conditions. Such data can help characterize, for example, the dynamic conditions of and interplay between drifting sea ice mélange and calving glacier fronts. Mélange, a term used to describe a mix of small, calved ice blocks and sea ice, can bind firmly and obstruct a glacier fjord. These types of ice cover can show strong seasonal variation, depending on ocean and atmospheric conditions [e.g., Amundson et al., 2010; Robel, 2017].
LEAP acquisitions provide coverage of Earth’s high latitudes through winter, enabling high-resolution year-round study of ice-ocean interfaces and mapping of polar surface ocean and sea ice thermal conditions.
Ice mélange has been implicated in restabilizing glaciers, but the loss of mélange, if it’s swept away by melting events or strong winds, can lead to increases in iceberg calving or glacier or ice sheet retreat. As ice shelf and ice front stability play fundamental roles in determining ice discharge, observing these processes is important for understanding present-day trends in and broader relationships among climate patterns, ice-ocean circulation, and ultimately future sea level rise.
The existing Landsat archive contains substantial coverage of winter sea ice, but acquisitions have not been systematic. LEAP creates more widespread, near-term coverage for comparison with the scattered periods of past coverage in the Landsat record.
Winter Landsat coverage, especially in proximity to the rapidly changing North Slope of Alaska, provides detailed and direct views of sea ice structure and concentration across one of the last remaining regions of multiyear sea ice in the Arctic. This imagery is useful in validating other satellite analyses of sea ice characteristics [Tanaka and Lu, 2023; Kern et al., 2022] and for evaluating ice surface temperatures [Fan et al., 2020] and the forces driving extensive rifts or ice compaction. Winter imagery also helps track sea ice evolution over time and can provide indicators of Indigenous groups’ hunting access [e.g., Mahoney et al., 2014; Cáceres et al., 2022].
For selected offshore Antarctic areas, year-round coverage of sea ice supports analysis of air-ocean interaction over polynyas (areas of open water surrounded by sea ice [Savidge et al., 2023]), important in the formation of Antarctic Bottom Water, and ice shelf stability. This mapping will be most important for small ice ocean features (<1 kilometer) that are not easily captured by other satellite sensors.
Advancing by LEAPs and Bounds
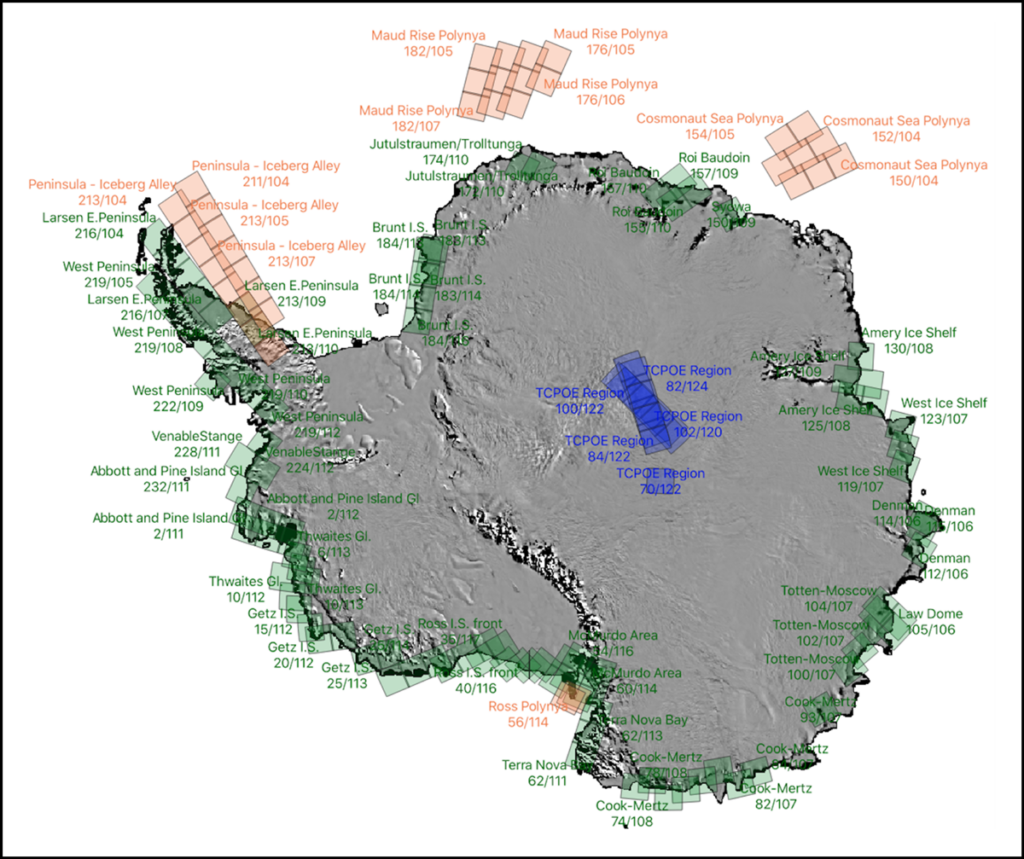
The LEAP acquisition plan includes coverage of 306 path-rows (a grid based on the 185-kilometer-wide orbit tracks and 185-kilometer image increments along the tracks) that support improved year-round monitoring and research on polar lands, ice sheets, and sea ice around Greenland, other parts of the Arctic, and Antarctica. LEAP acquisitions for Antarctica and its surrounding ocean, for example, illustrate the enhanced coverage around the continent, particularly of sensitive areas such as the Antarctic Peninsula, Thwaites Glacier, and the Ross Ice Shelf (Figure 4). The full set of maps and data describing the areas covered by LEAP is available at this link.
Ice is dynamic. It moves and melts, forms and disappears, on daily, seasonal, and longer timescales. It is also a critical control on climate and sea level. Yet Earth’s ice is changing dramatically as the planet warms. The LEAP program extends our ability to map and measure these changes into the polar night.
References
Amundson, J. M., et al. (2010), Ice mélange dynamics and implications for terminus stability, Jakobshavn Isbræ, Greenland, J. Geophys. Res. Earth Surf., 115(F1), F01005, https://doi.org/10.1029/2009JF001405.
Cáceres, A., E. Schwarz, and W. Aldenhoff (2022), Landsat-8 sea ice classification using deep neural networks, Remote Sens., 14(9), 1975, https://doi.org/10.3390/rs14091975.
Clancy, R., J. Manning, and H. Brolsma (2014), Antarctica 1940–1960: A second world war and a new order of business, in Mapping Antarctica: A Five Hundred Year Record of Discovery, pp. 195–219, Springer, Dordrecht, Netherlands, https://doi.org/10.1007/978-94-007-4321-2_7.
Crawford, C. J., et al. (2023), The 50-year Landsat collection 2 archive, Sci. Remote Sens., 8, 100103, https://doi.org/10.1016/j.srs.2023.100103.
Fan, P., et al. (2020), Sea ice surface temperature retrieval from Landsat 8/TIRS: Evaluation of five methods against in situ temperature records and MODIS IST in Arctic region, Remote Sens. Environ., 248, 111975, https://doi.org/10.1016/j.rse.2020.111975.
Kern, S., et al. (2022), Satellite passive microwave sea-ice concentration data set intercomparison using Landsat data, Cryosphere, 16(1), 349–378, https://doi.org/10.5194/tc-16-349-2022.
Mahoney, A. R., et al. (2014), Landfast sea ice extent in the Chukchi and Beaufort Seas: The annual cycle and decadal variability, Cold Reg. Sci. Technol., 103, 41–56, https://doi.org/10.1016/j.coldregions.2014.03.003.
Robel, A. A. (2017), Thinning sea ice weakens buttressing force of iceberg mélange and promotes calving, Nat. Commun., 8, 14596, https://doi.org/10.1038/ncomms14596.
Roy, D. P., et al. (2014), Landsat-8: Science and product vision for terrestrial global change research, Remote Sens. Environ., 145, 154–172, https://doi.org/10.1016/j.rse.2014.02.001.
Savidge, E., et al. (2023), Wintertime polynya structure and variability from thermal remote sensing and seal-borne observations at Pine Island Glacier, West Antarctica, IEEE Trans. Geosci. Remote Sens., 61, 4300813, https://doi.org/10.1109/TGRS.2023.3271453.
Scambos, T. A., et al. (2018), Ultralow surface temperatures in East Antarctica from satellite thermal infrared mapping: The coldest places on Earth, Geophys. Res. Lett., 45(12), 6,124–6,133, https://doi.org/10.1029/2018GL078133.
Tanaka, Y., and J. Lu (2023), A new sea ice concentration retrieval algorithm based on relationship between AMSR2 89-GHz polarization and Landsat 8 observations, IEEE Trans. Geosci. Remote Sens., 61, 4300415, https://doi.org/10.1109/TGRS.2023.3257401.
Wulder, M. A., et al. (2022), Fifty years of Landsat science and impacts, Remote Sens. Environ., 280, 113195, https://doi.org/10.1016/j.rse.2022.113195.
Author Information
Ted Scambos ([email protected]), Earth Science and Observation Center, Cooperative Institute for Research in Environmental Science, University of Colorado Boulder; Christopher Shuman, Goddard Earth Sciences Technology and Research II, University of Maryland, Baltimore County, Catonsville; also at Cryospheric Sciences Laboratory, NASA Goddard Space Flight Center, Greenbelt, Md.; Mark Fahnestock, Geophysical Institute, University of Alaska Fairbanks; Tasha Snow, Department of Geophysics, Colorado School of Mines, Golden; and Christopher Crawford, Earth Resources Observation and Science Center, U.S. Geological Survey, Sioux Falls, S.D.